Thechartstore.com does not promote the use of the information contained herein for any specific purpose, and makes no representations or warranties that the information contained in this publication is suitable for the particular purposes of the subscriber or any other party. Thechartstore.com assumes no responsibility or liability of any kind for the use of the information contained herein by the subscriber or any other party. Reproduction of any or all of the Weekly Chart Blog without prior permission is prohibited.
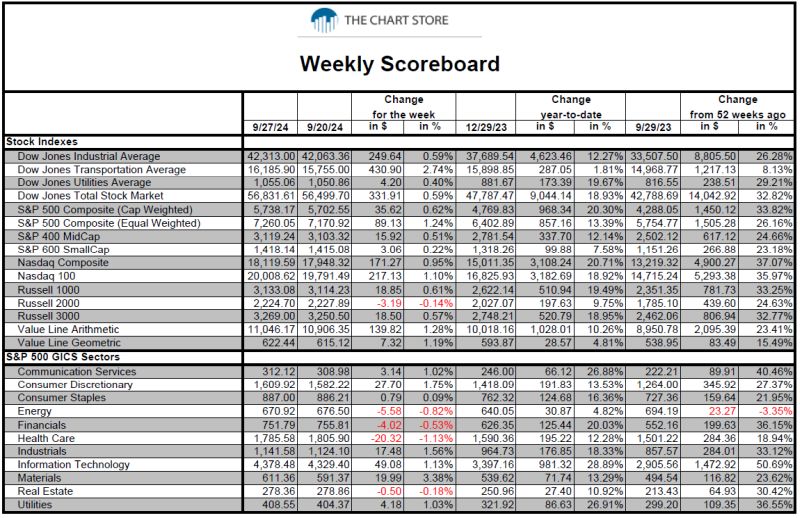
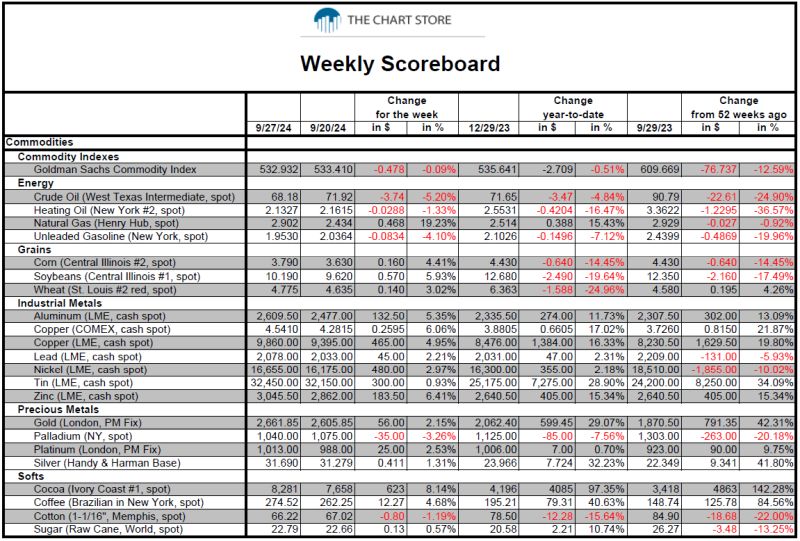
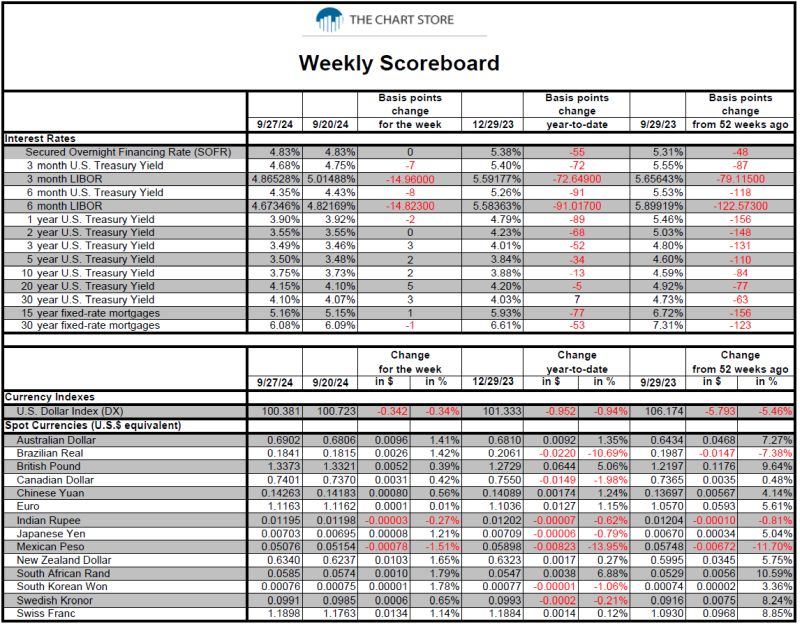
- The Weekly Scoreboard.
- Charts 1 through 11 - Major U.S. Stock Index Watch.
- Charts 12 through 22 - S&P GICS Sector Watch.
- Charts 23 through 36 - Stock Market Indicator Watch.
- Charts 37 through 46 - Analog Chart Watch.
- Charts 47 through 66 - Interest Rate Watch.
- Charts 67 through 74 - Currency Watch.
- Charts 75 through 96 - Commodity Watch.
- Charts 97 through 106 - Fed Watch.
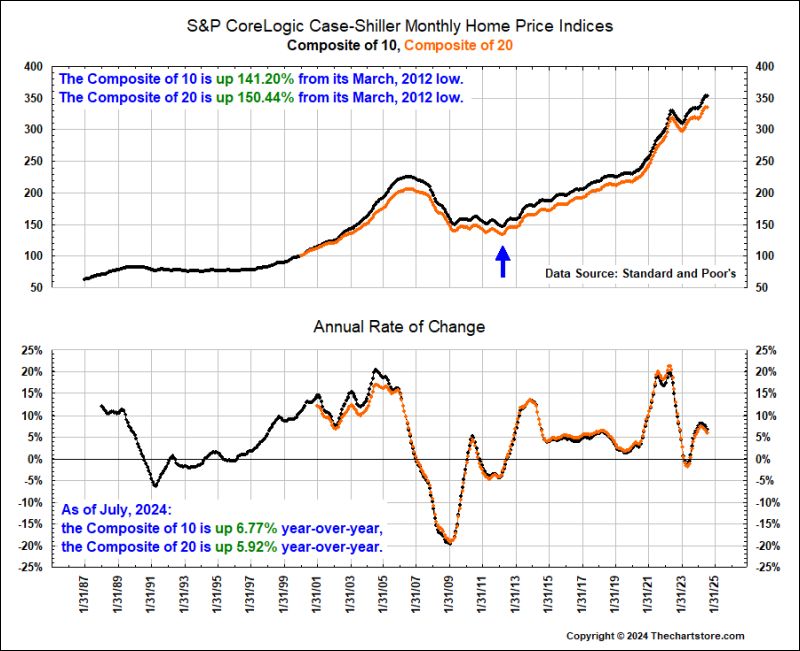
- Chart 107 and Four Tables - S&P CoreLogic Case-Shiller Monthly Home Price Indexes Watch.
- Charts 108 through 112 and Two Tables - GDP Watch.
- Charts 113 through 117 and Table - Personal Income and Outlays Watch.
- Charts 118 through 120 and Table - PCE and Other Inflation Watch.
For the Weekly Scoreboard in .pdf format, click here.
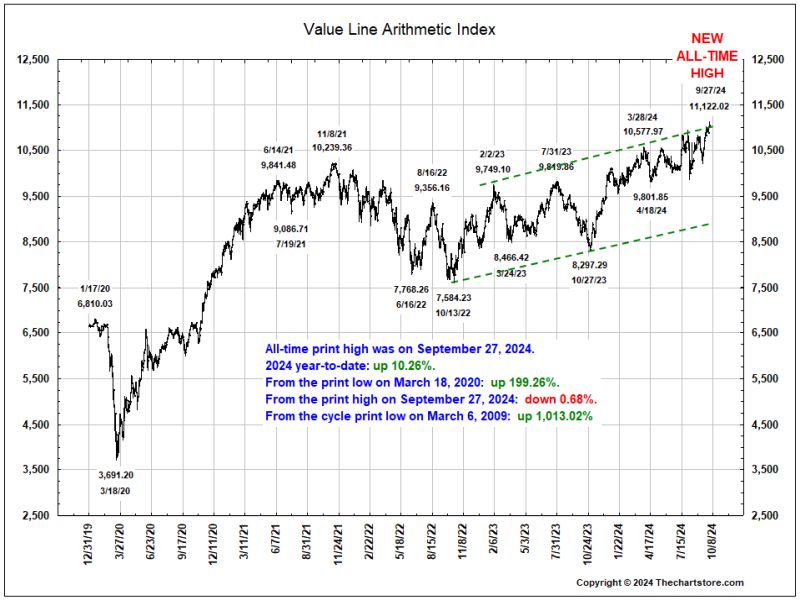
Major U.S. Stock Index Watch
Chart 1
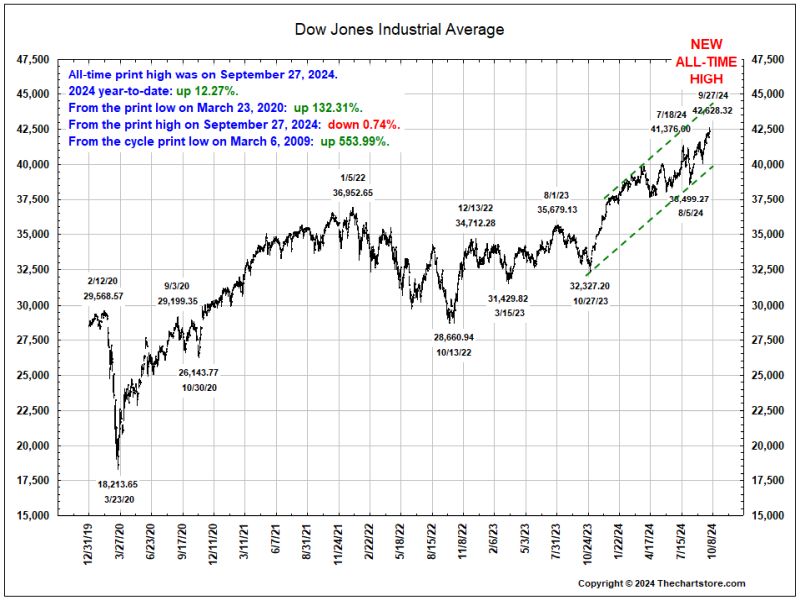
Chart 2
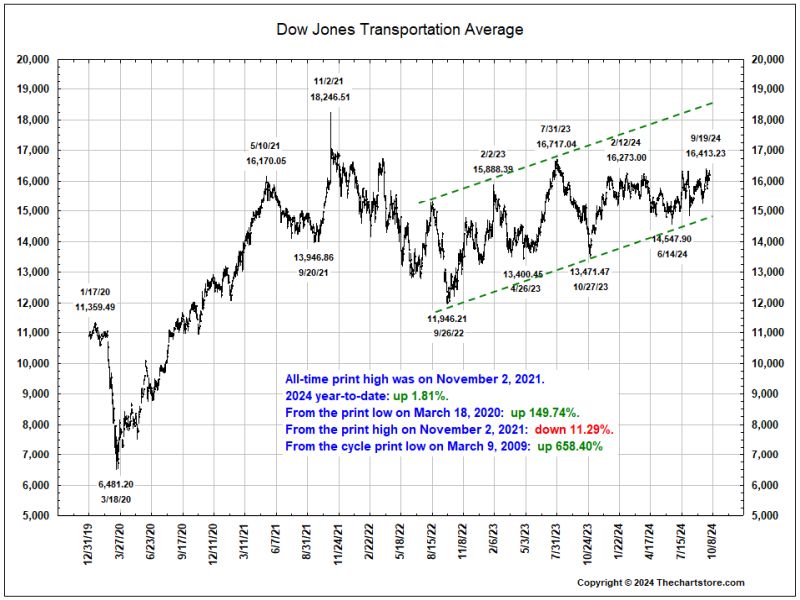
Chart 3
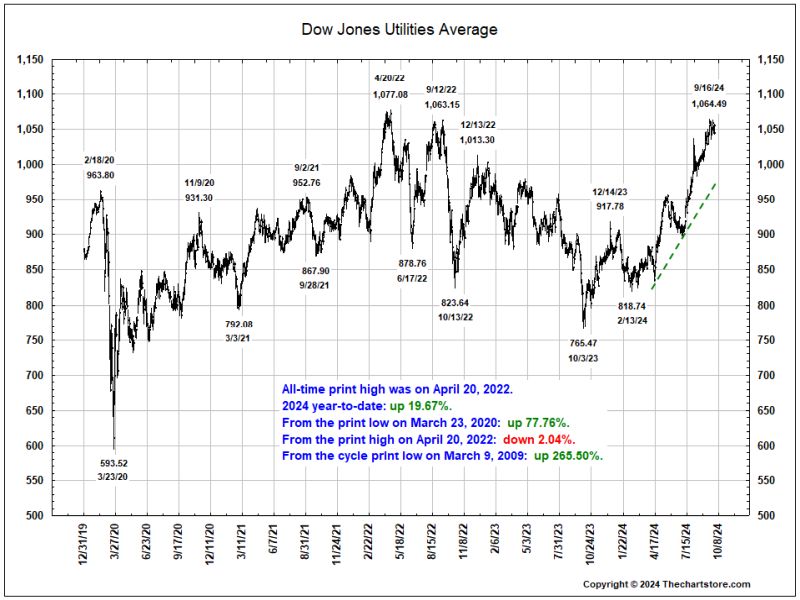
Chart 4
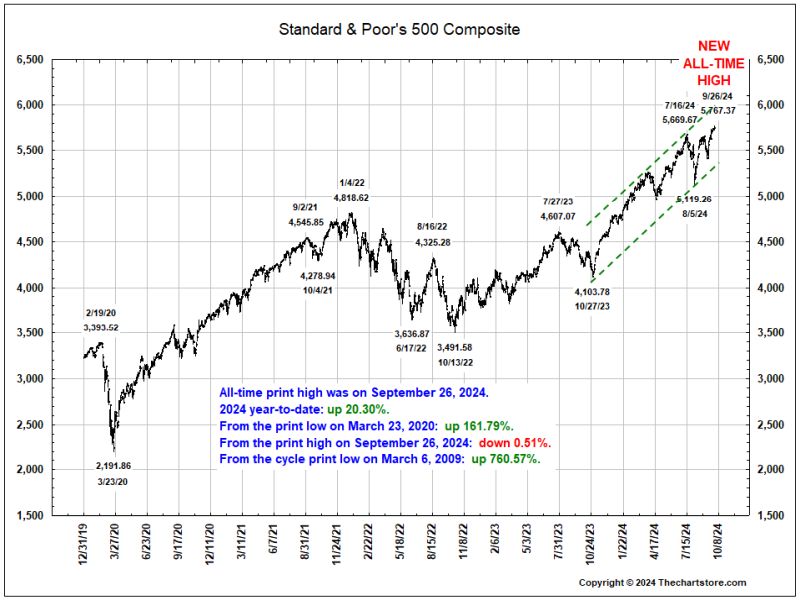
Chart 5
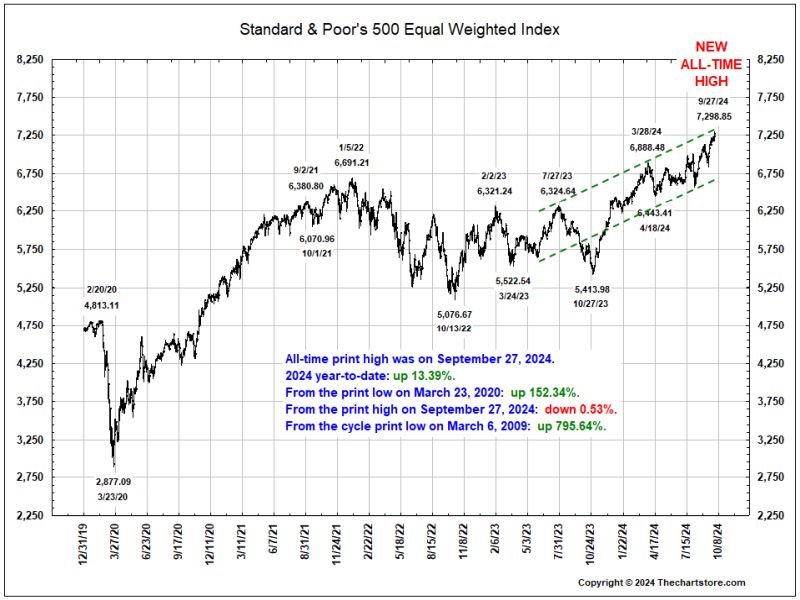
Chart 6
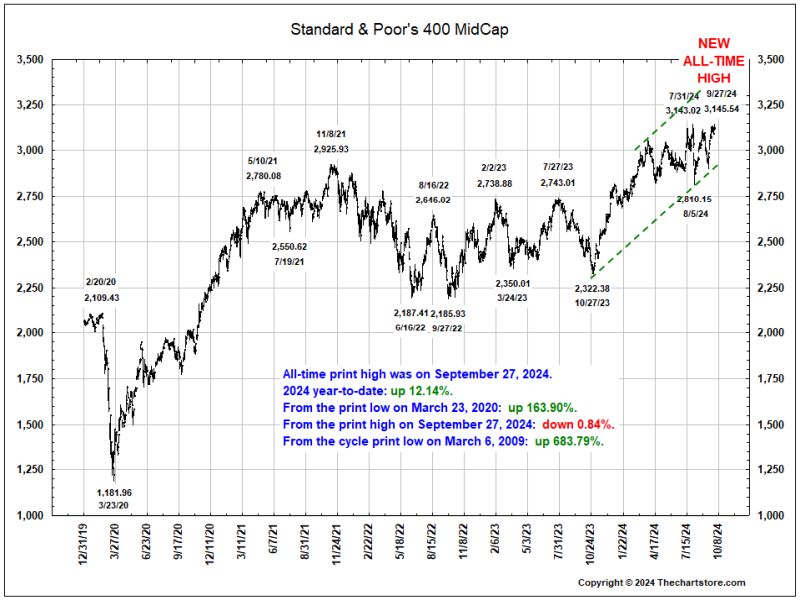
Chart 7
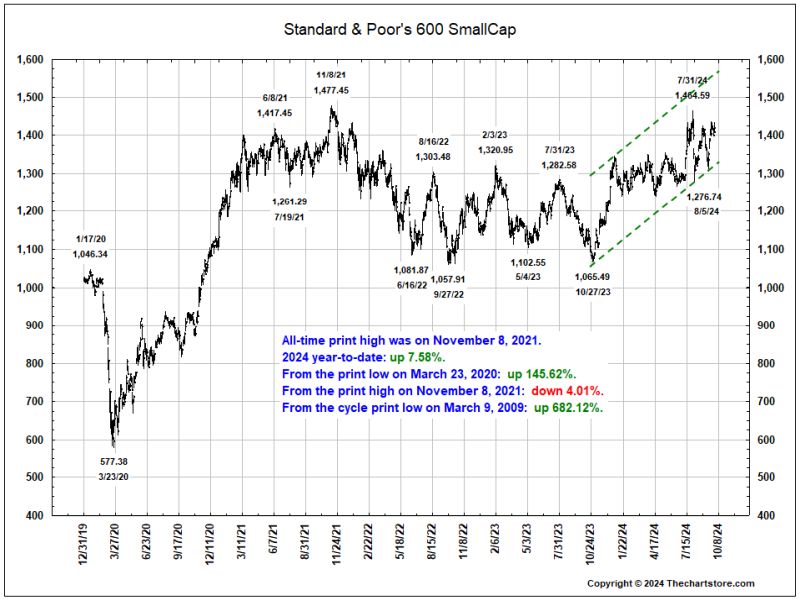
Chart 8
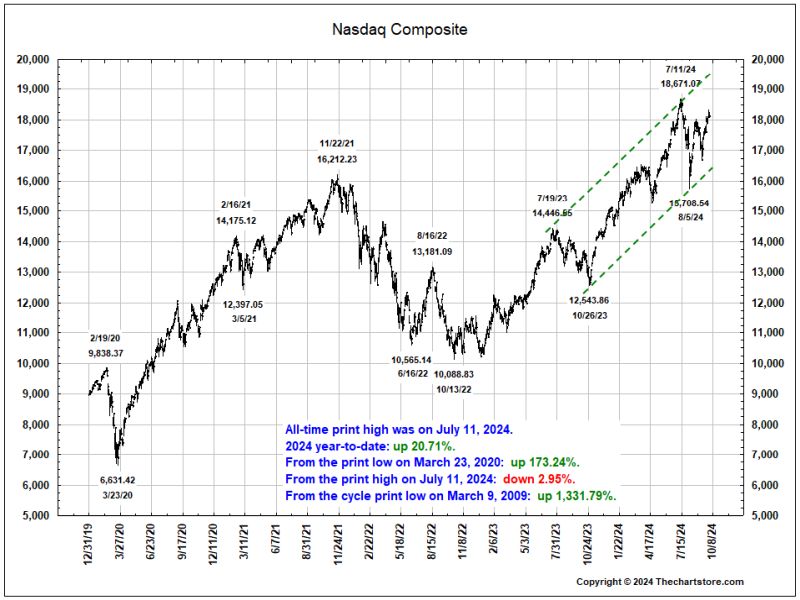
Chart 9
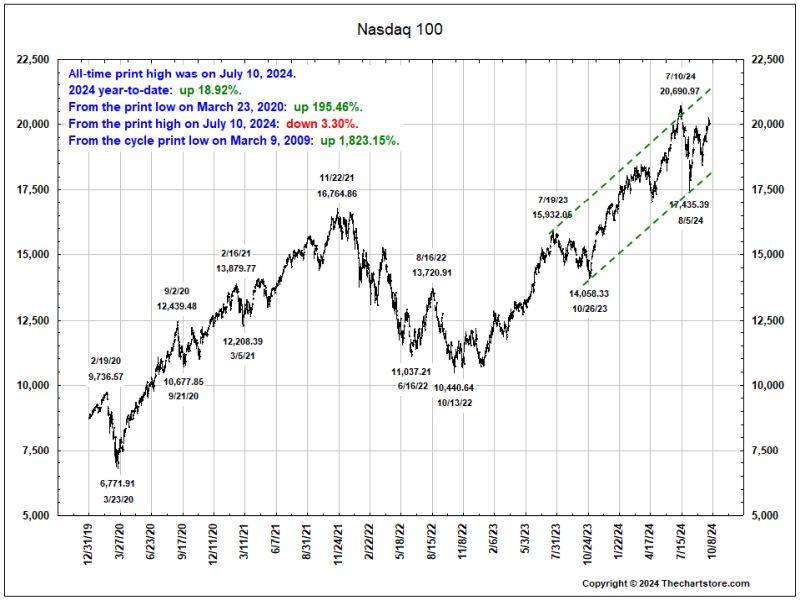
Chart 10

Chart 11
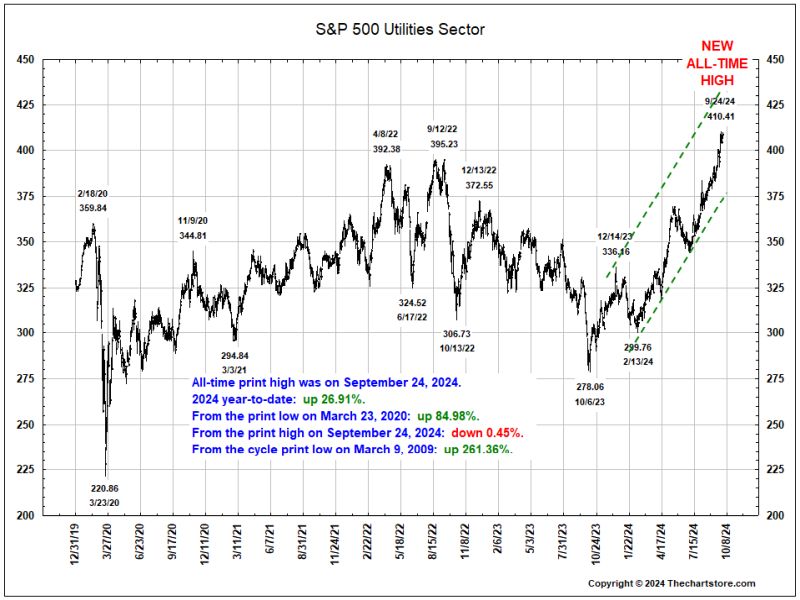
S&P GICS Sector Watch
Chart 12
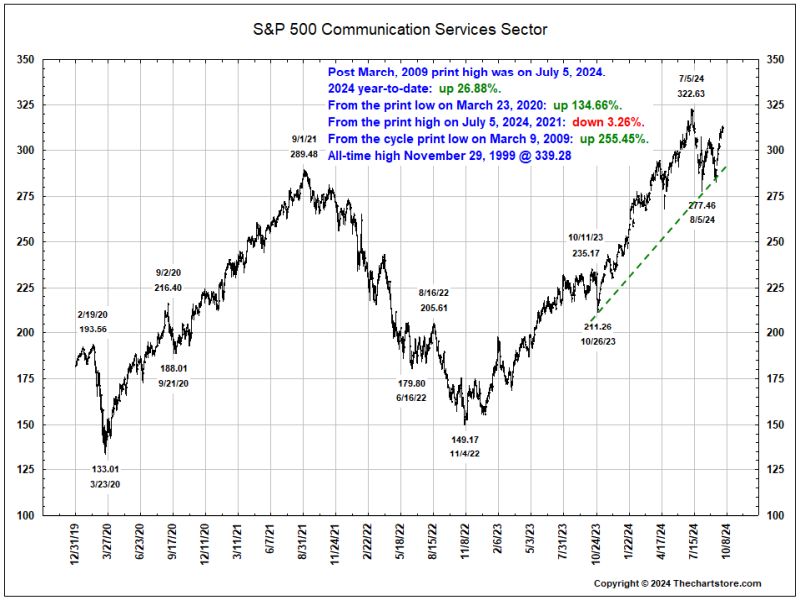
Chart 13
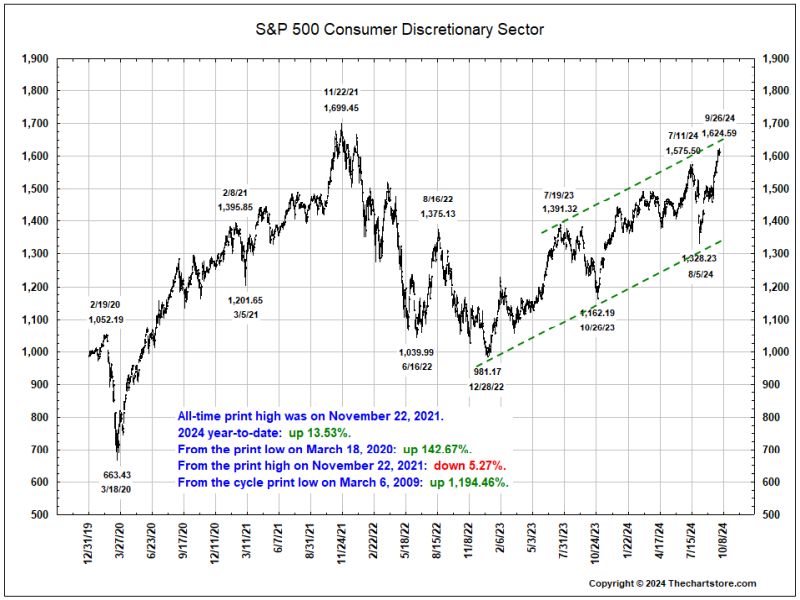
Chart 14
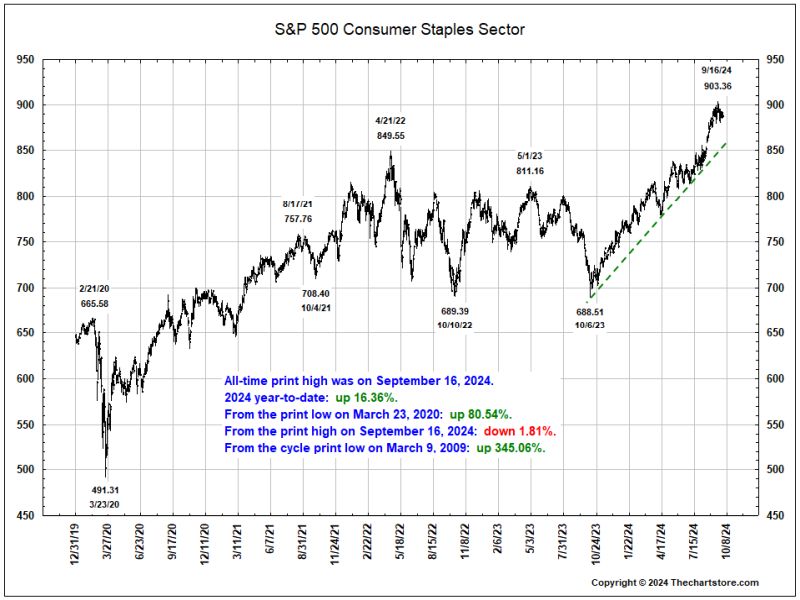
Chart 15
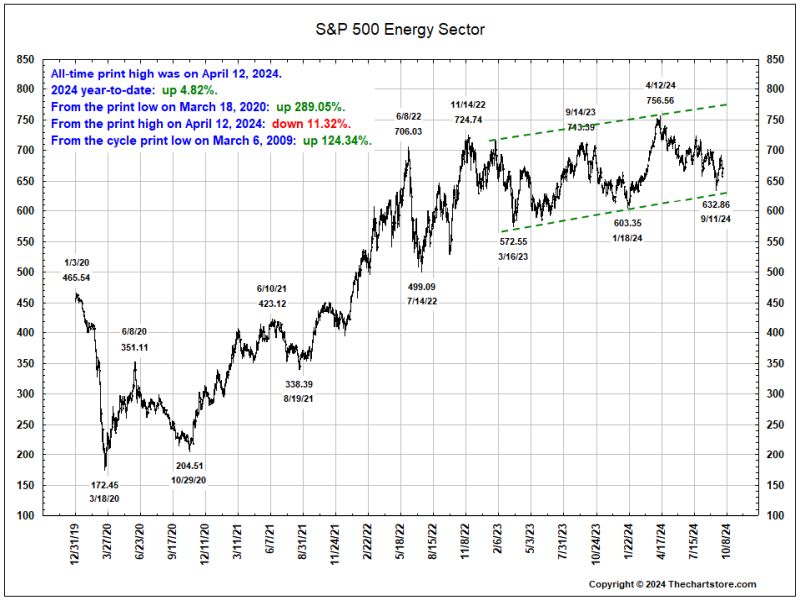
Chart 16
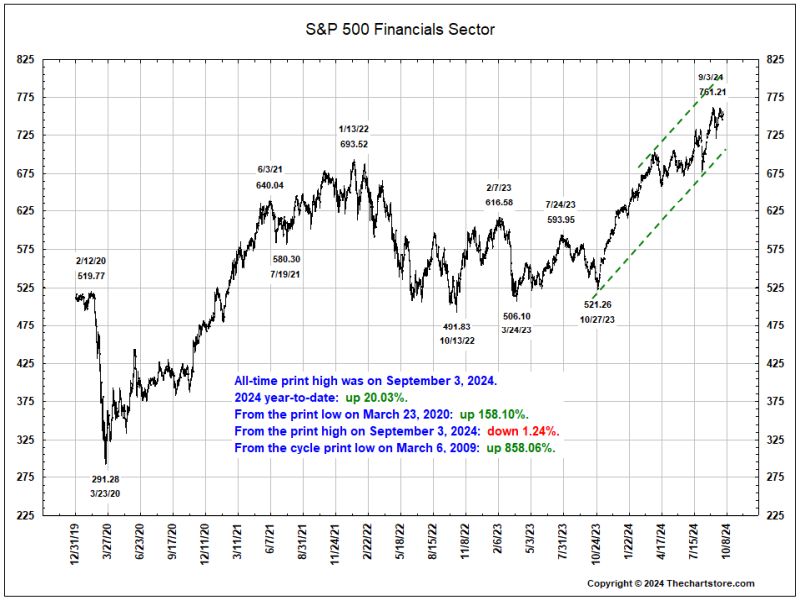
Chart 17
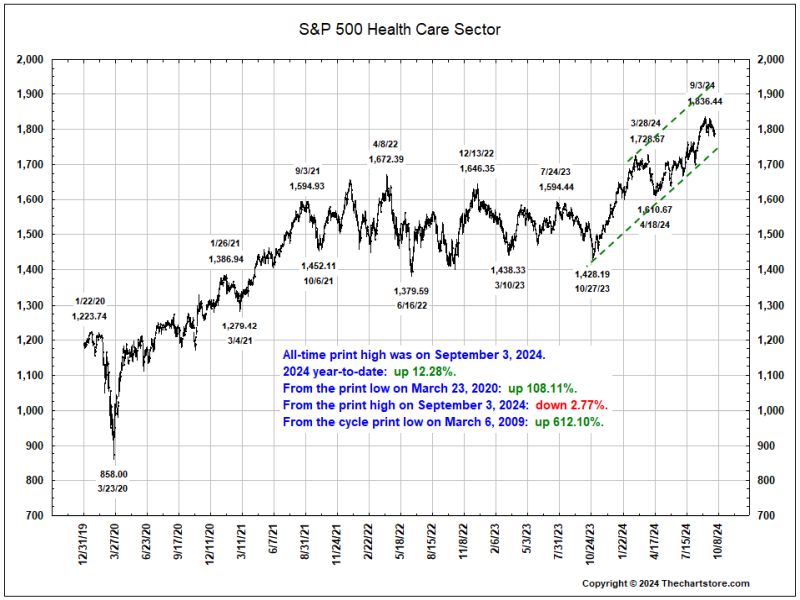
Chart 18
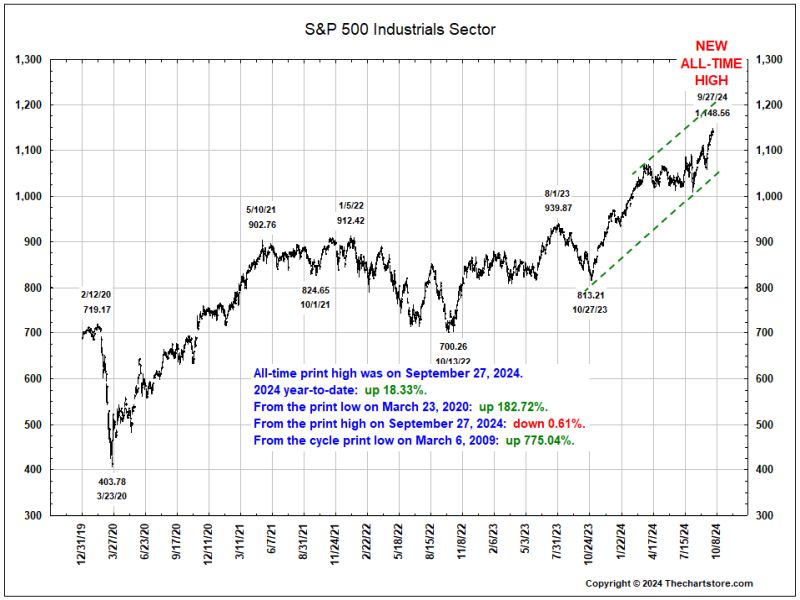
Chart 19
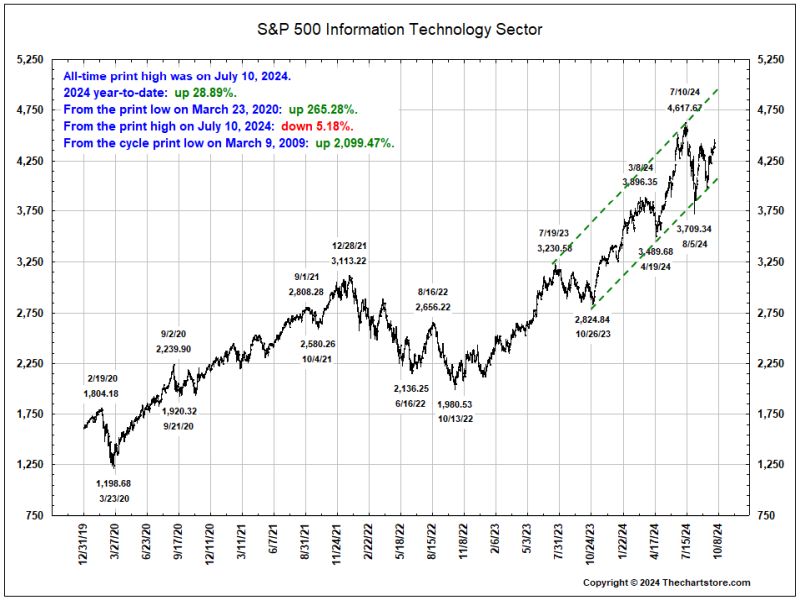
Chart 20
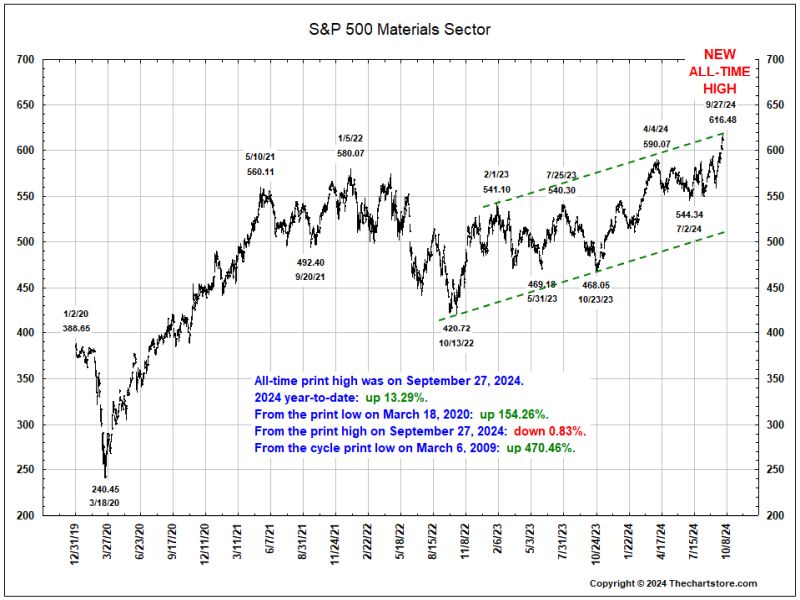
Chart 21
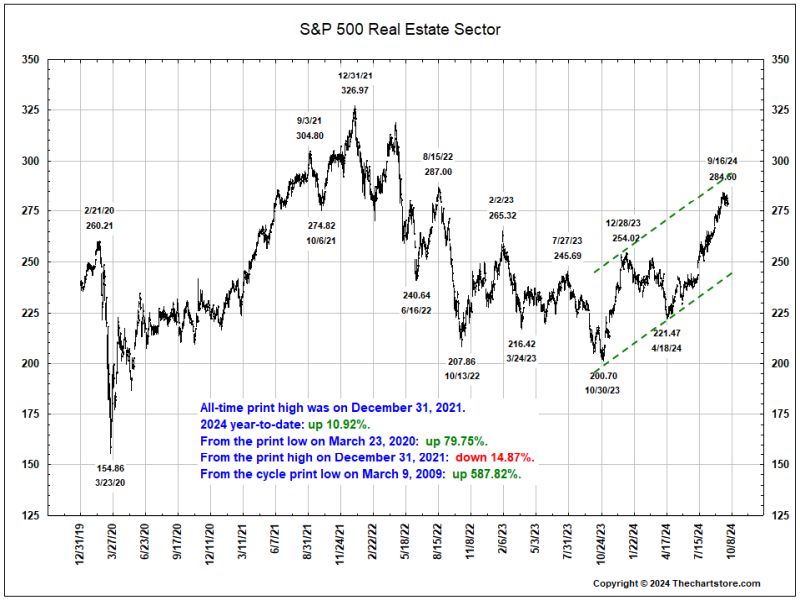
Chart 22
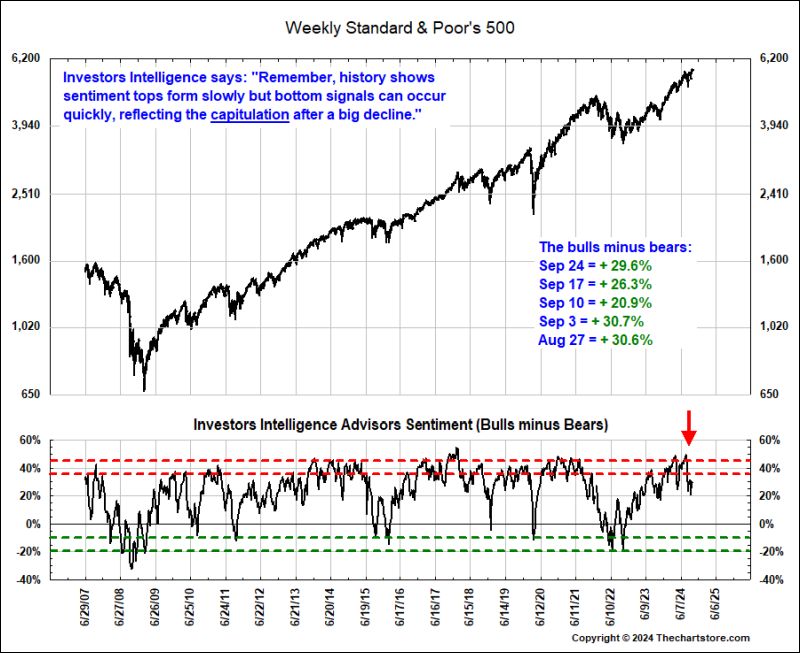
Stock Market Indicator Watch
Chart 23
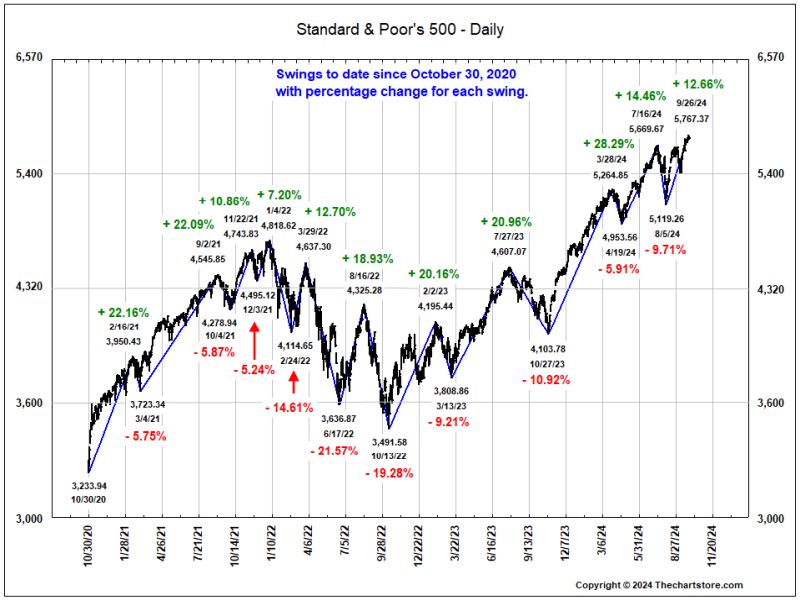
Chart 24
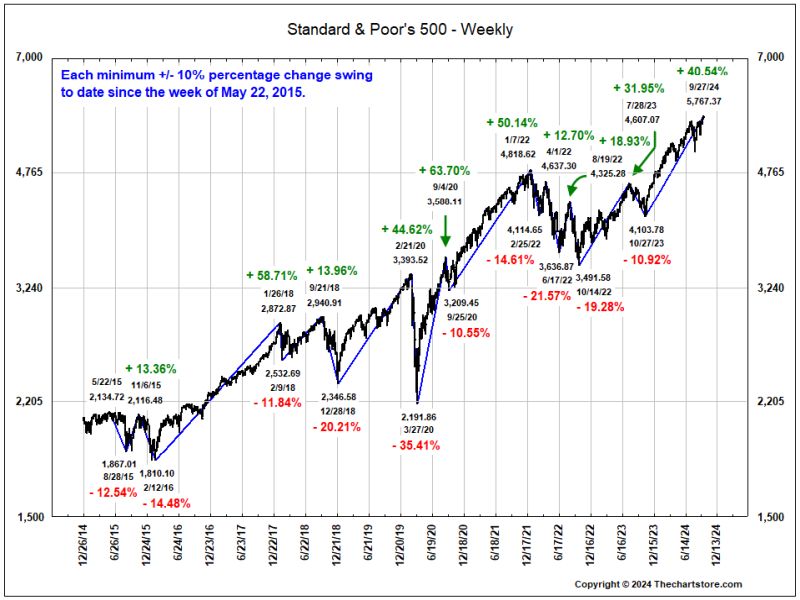
Chart 25
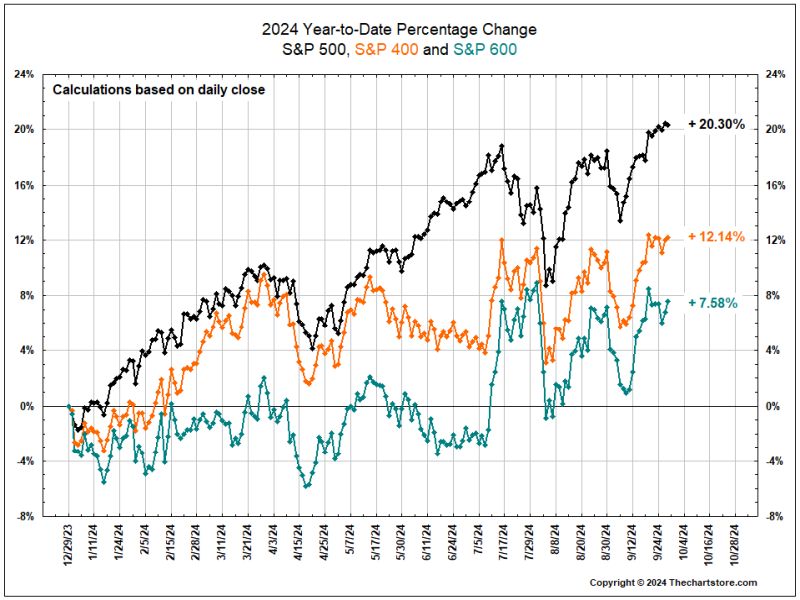
Chart 26
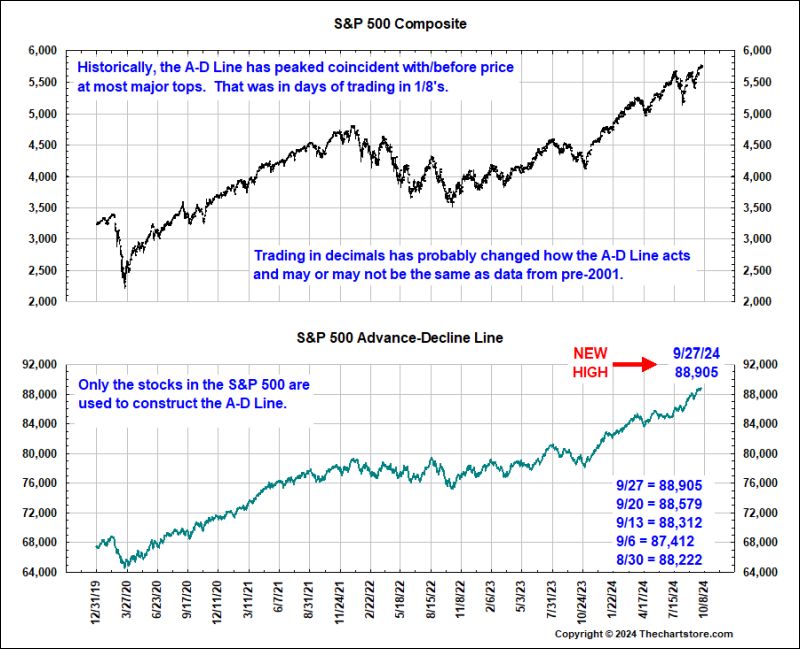
Chart 27
Chart 28
Chart 29
Chart 30
Chart 31
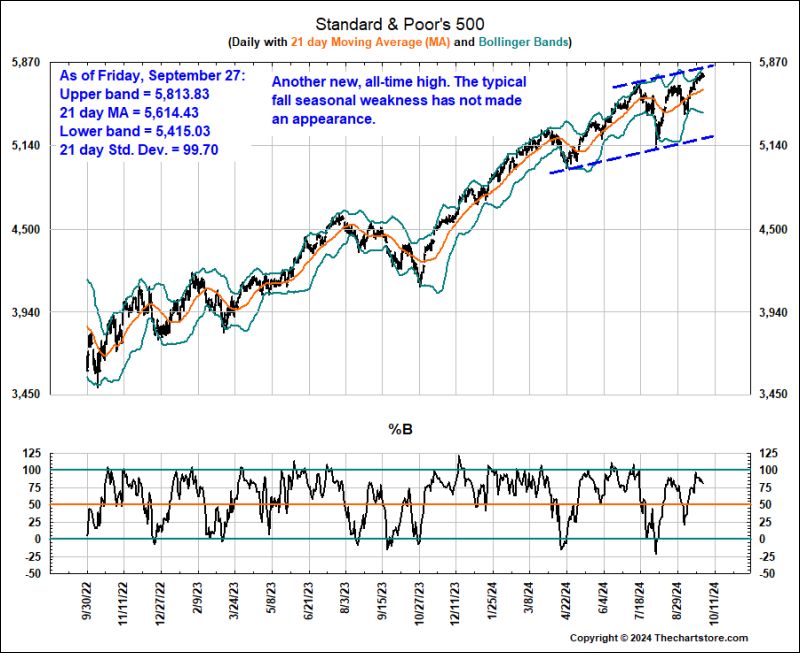
Chart 32
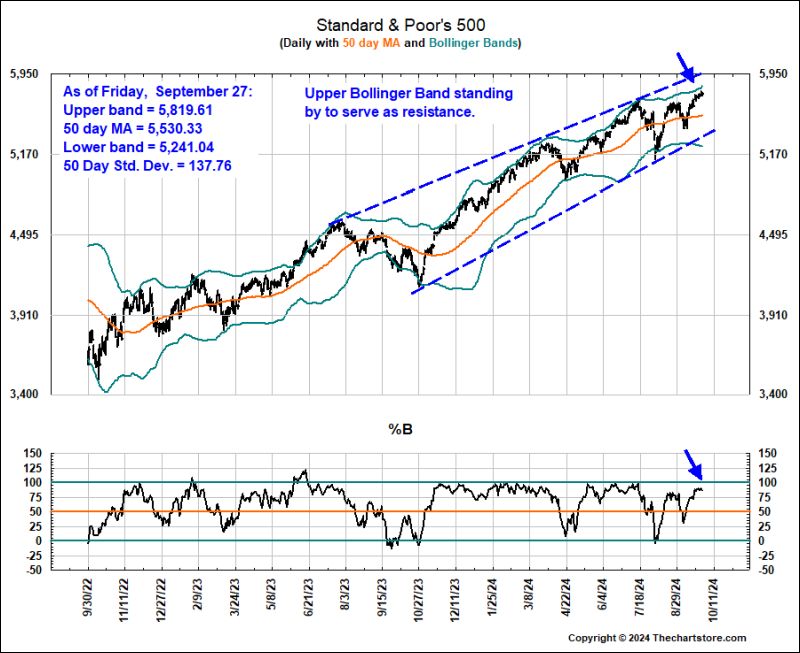
Chart 33
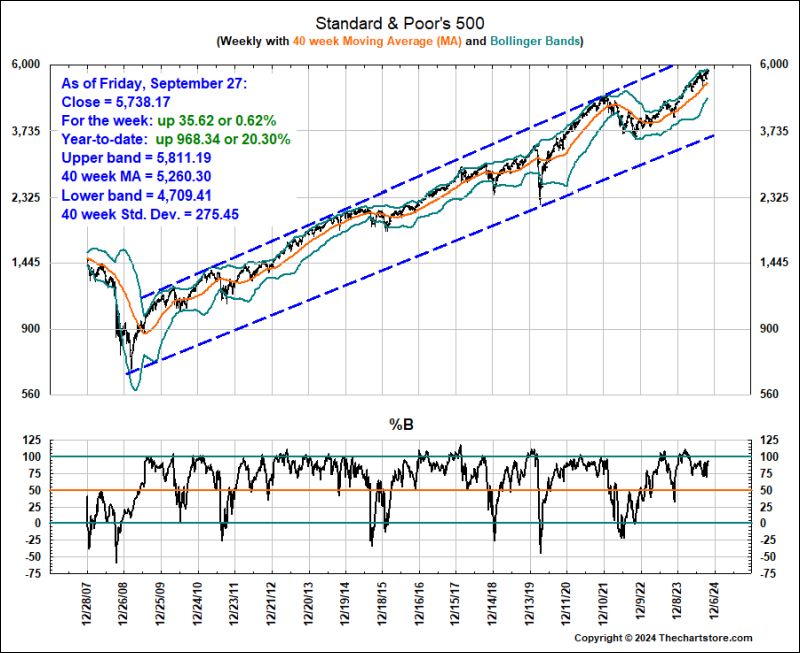
Chart 34
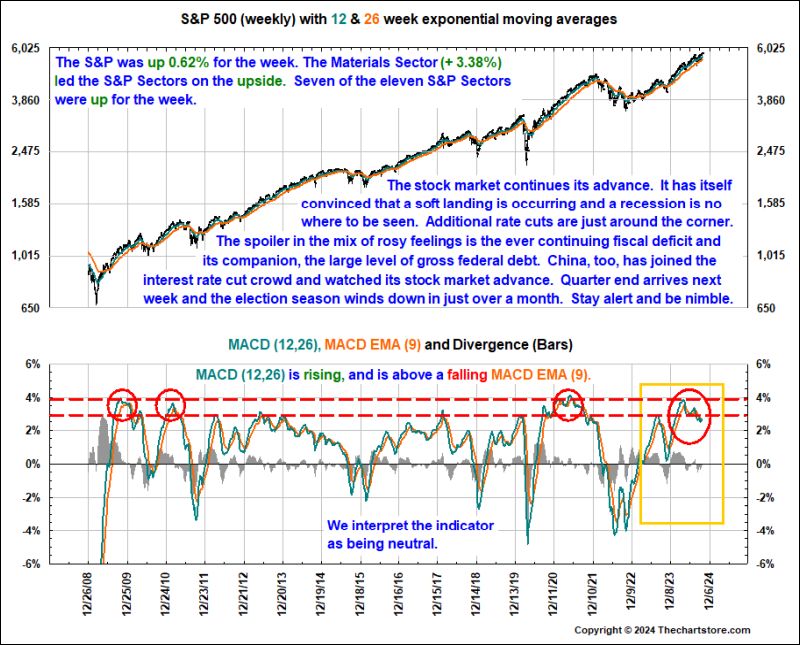
Chart 35
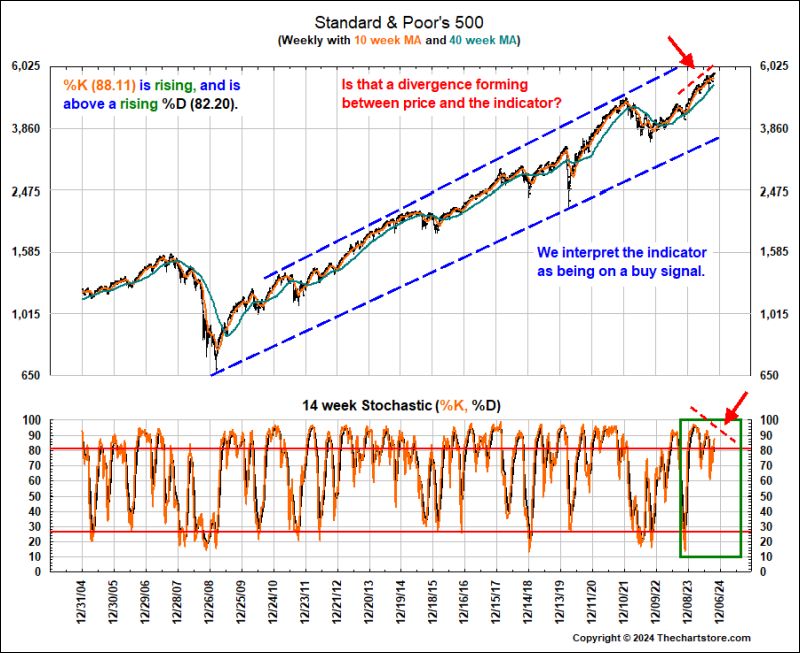
Chart 36
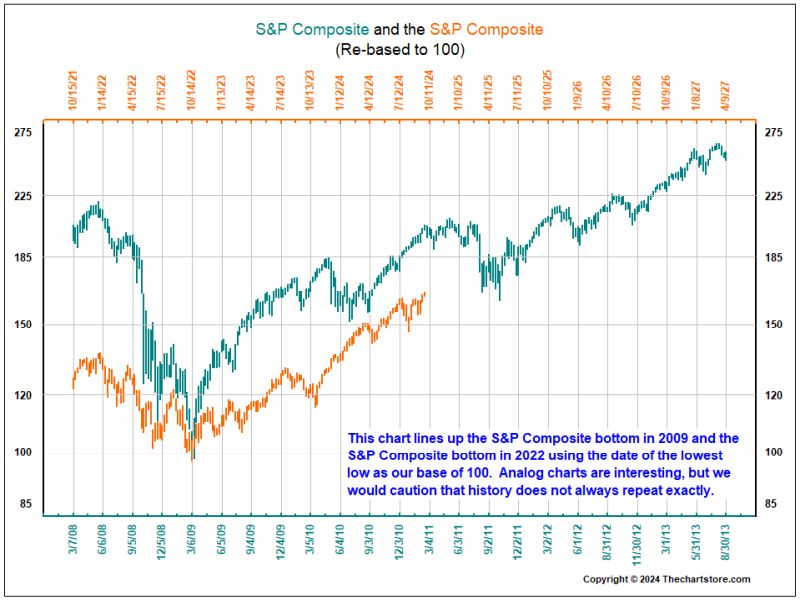
Analog Chart Watch
Chart 37
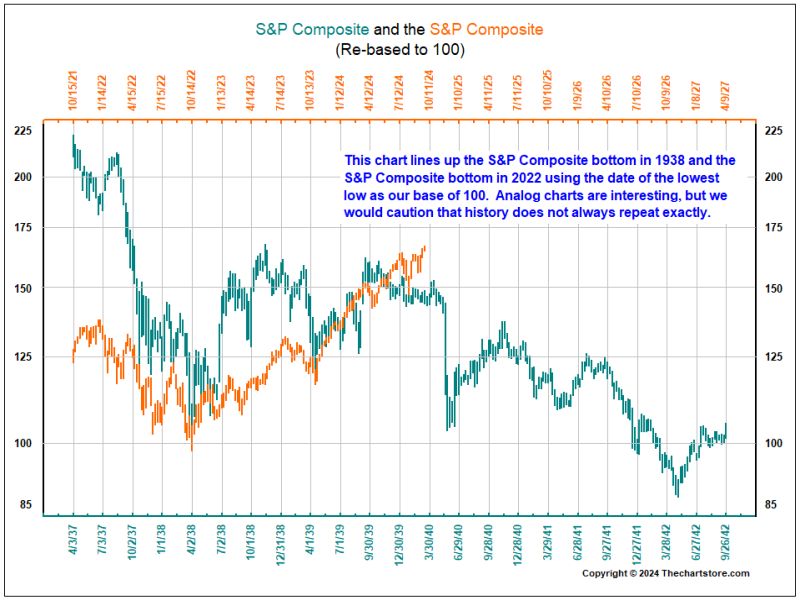
Chart 38
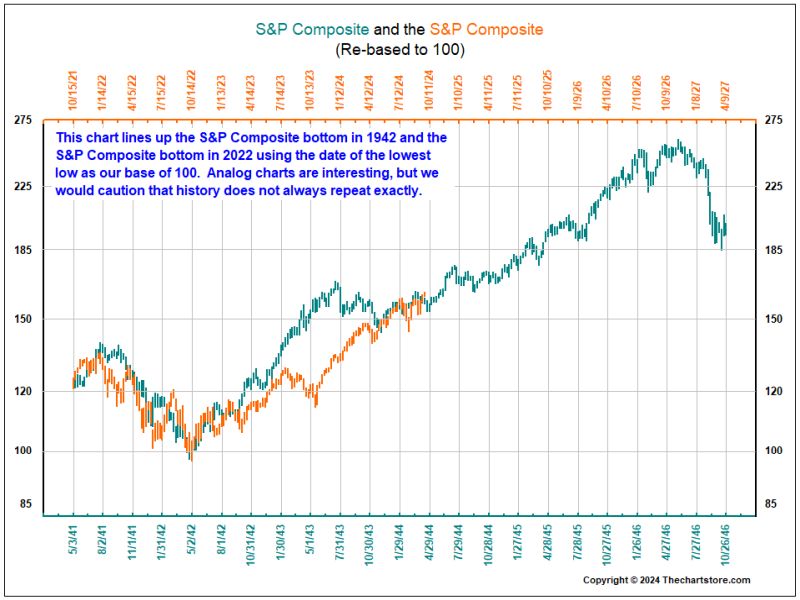
Chart 39
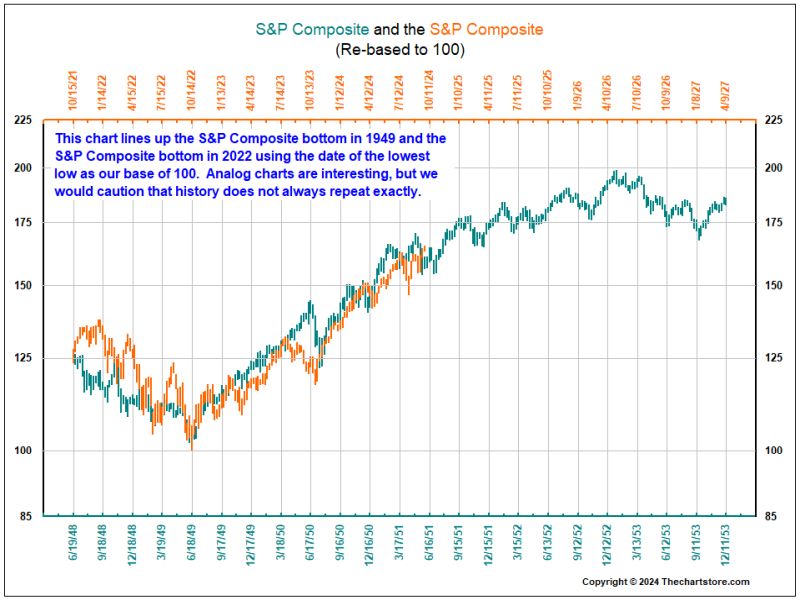
Chart 40
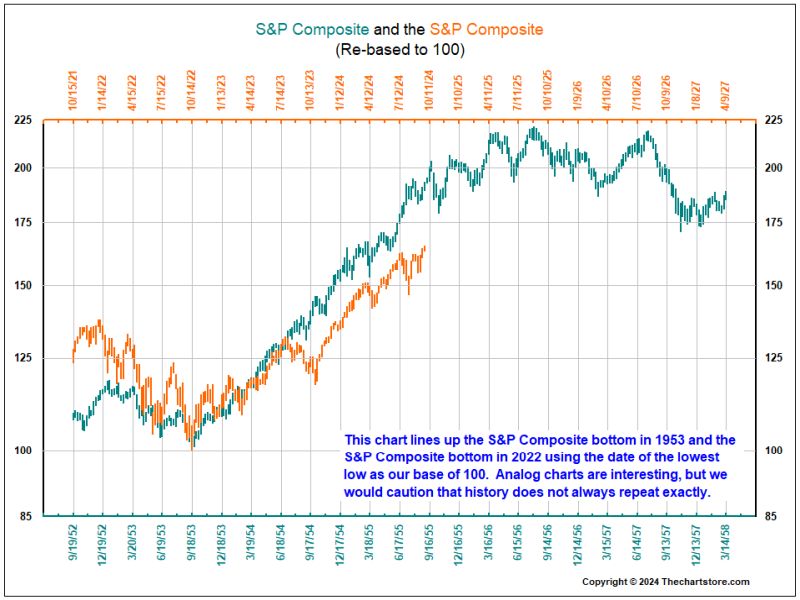
Chart 41
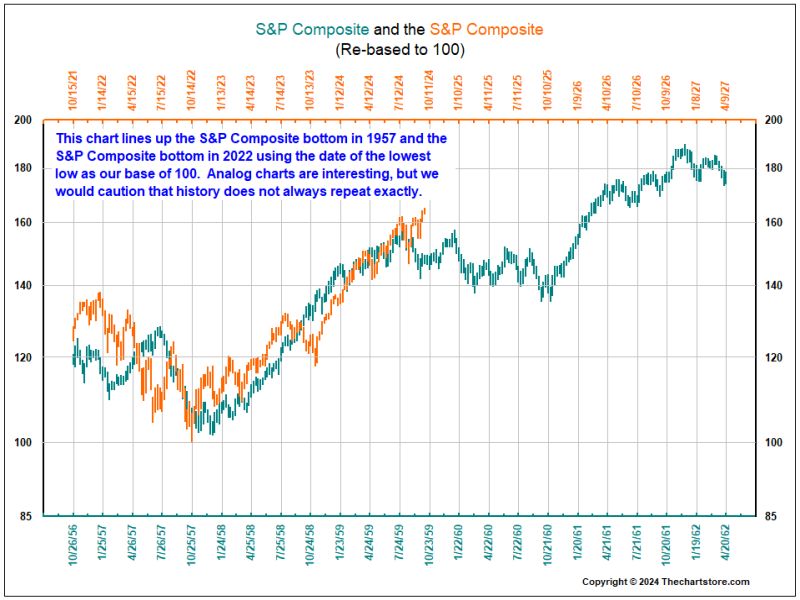
Chart 42
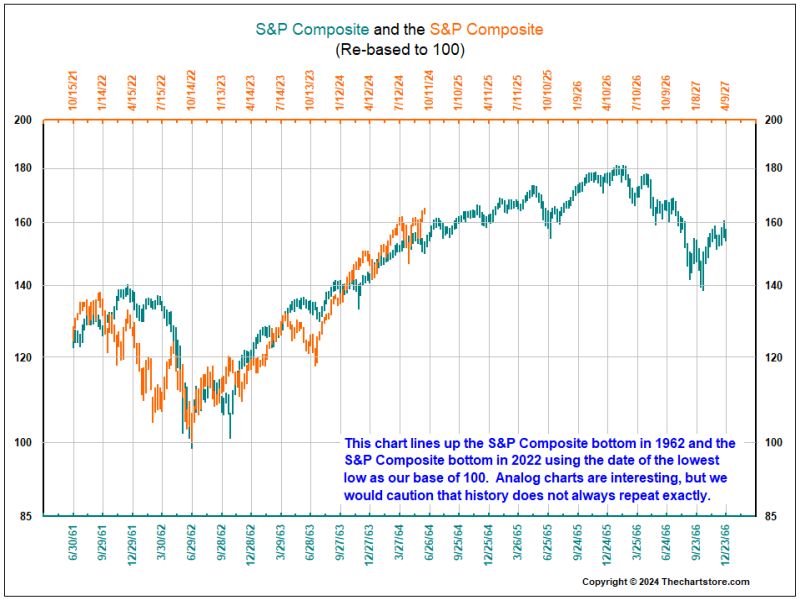
Chart 43
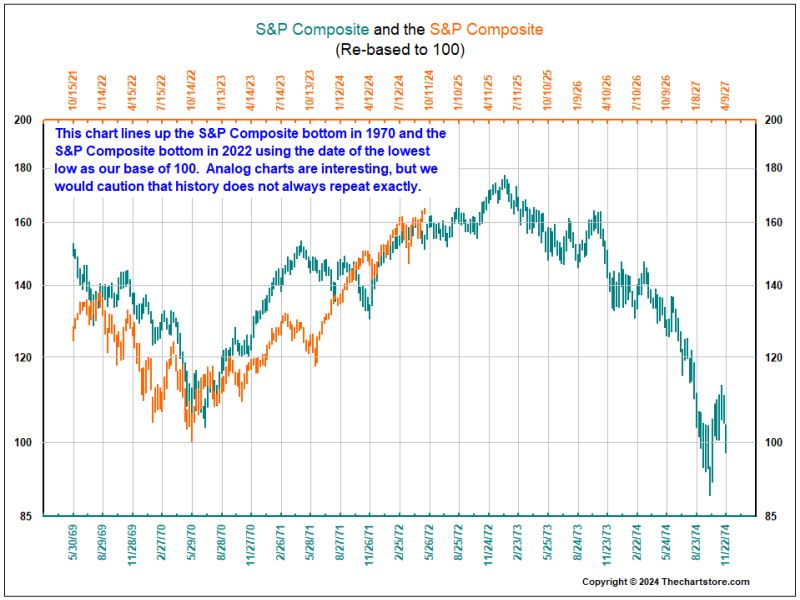
Chart 44
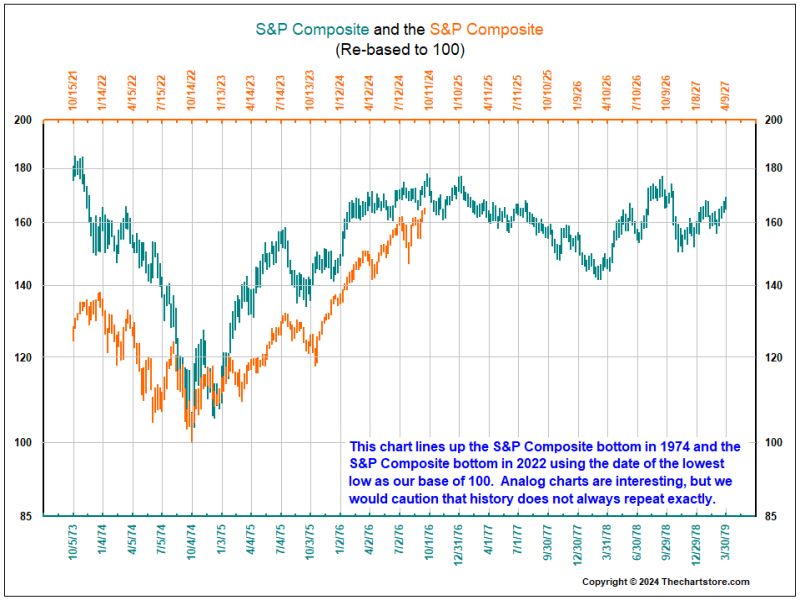
Chart 45
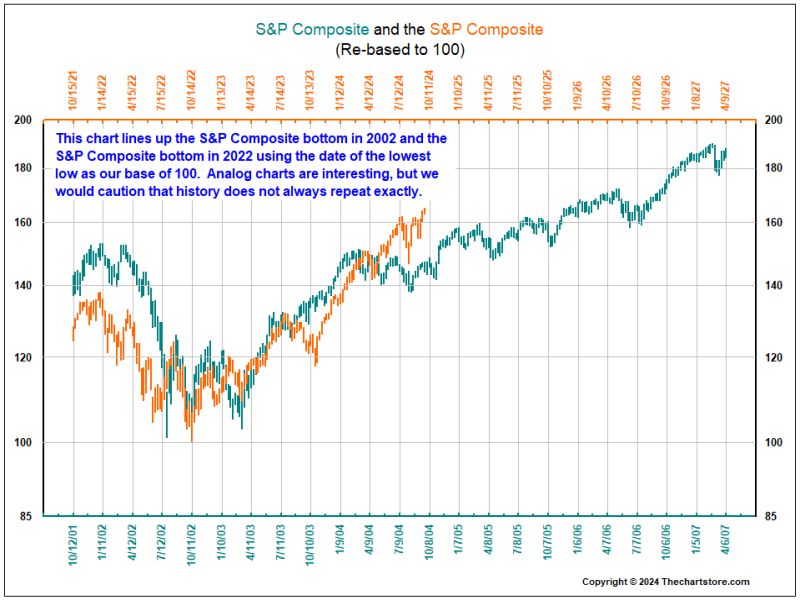
Chart 46
Interest Rate Watch
Chart 47
Chart 48
Chart 49
Chart 50

Chart 51
Chart 52
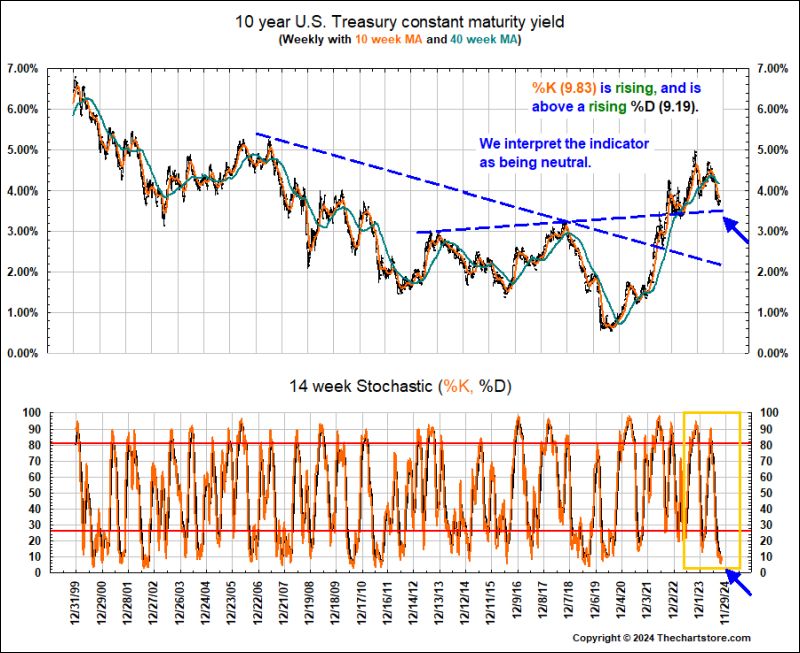
Chart 53
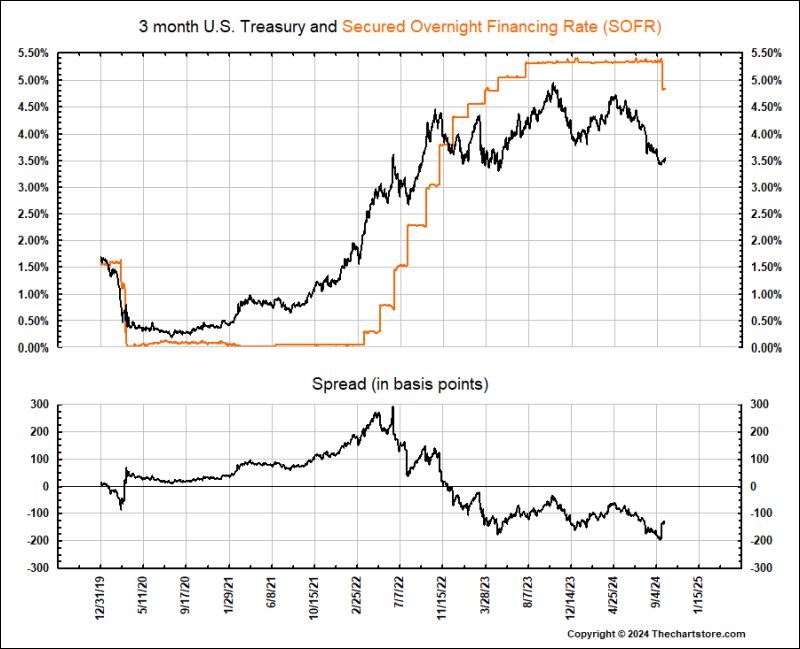
Chart 54
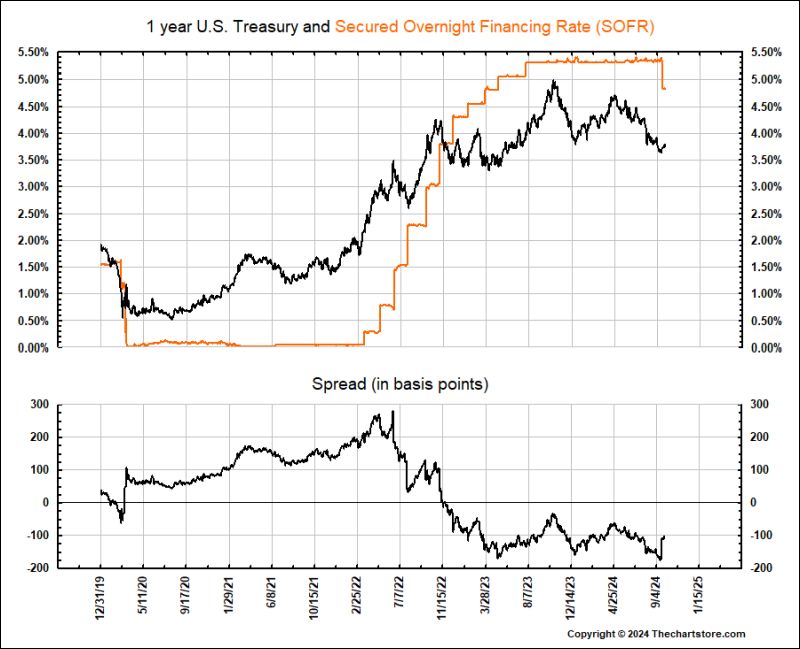
Chart 55
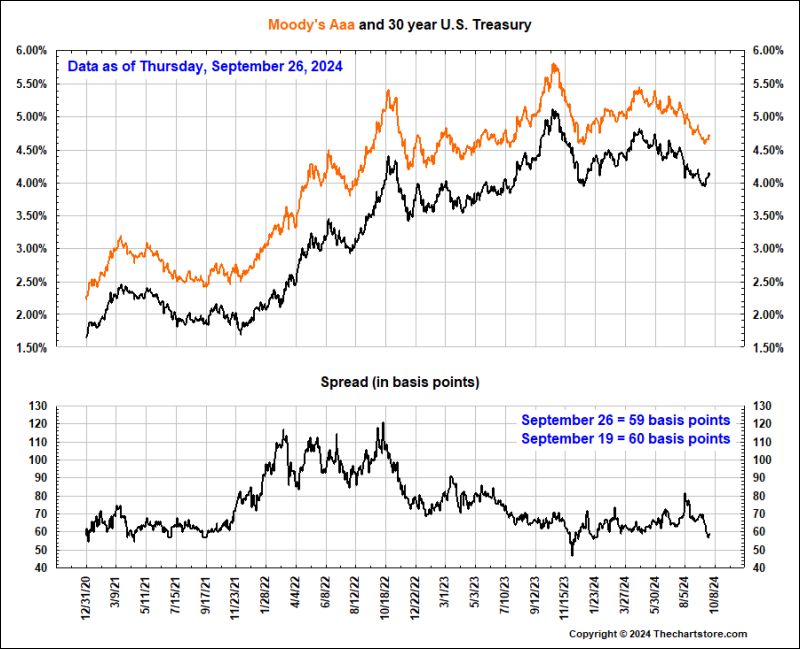
Chart 56

Chart 57
Chart 58
Chart 59

Chart 60
Chart 61
Chart 62
Chart 63

Chart 64
Chart 65
Chart 66
Currency Watch
Chart 67
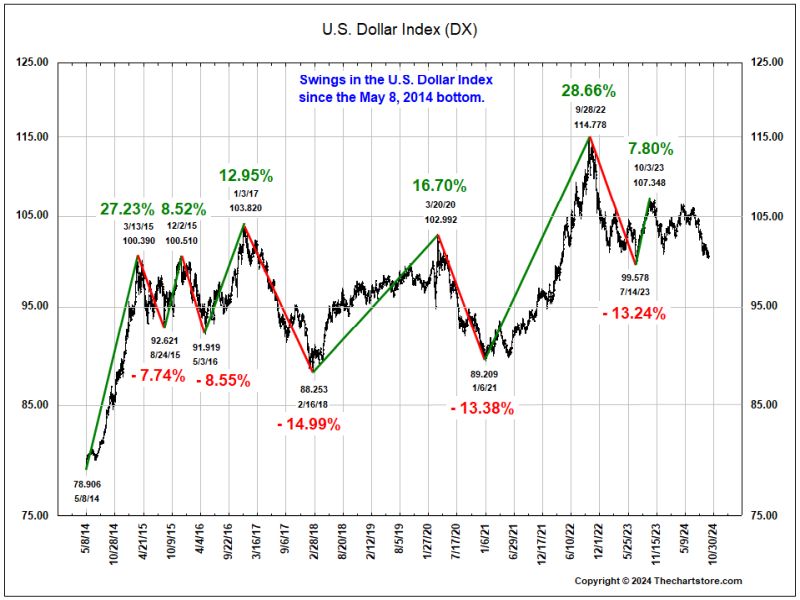
Chart 68
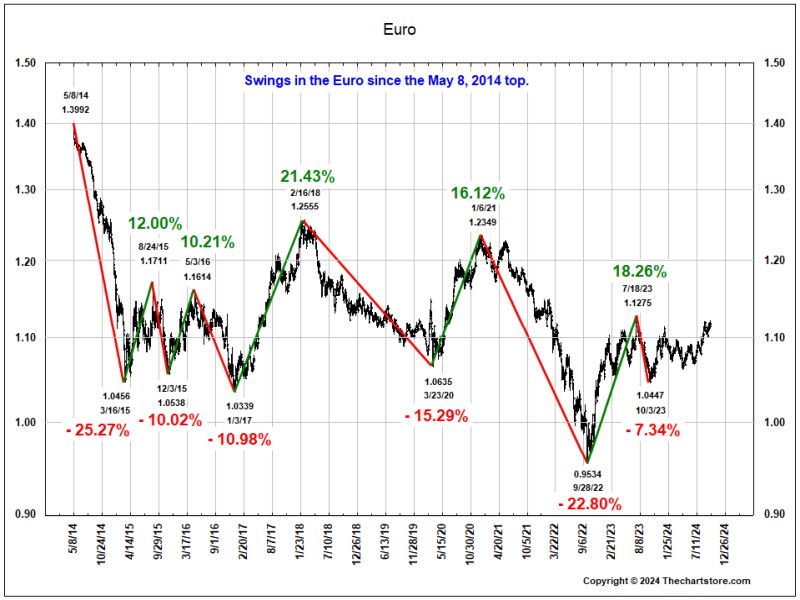
Chart 69
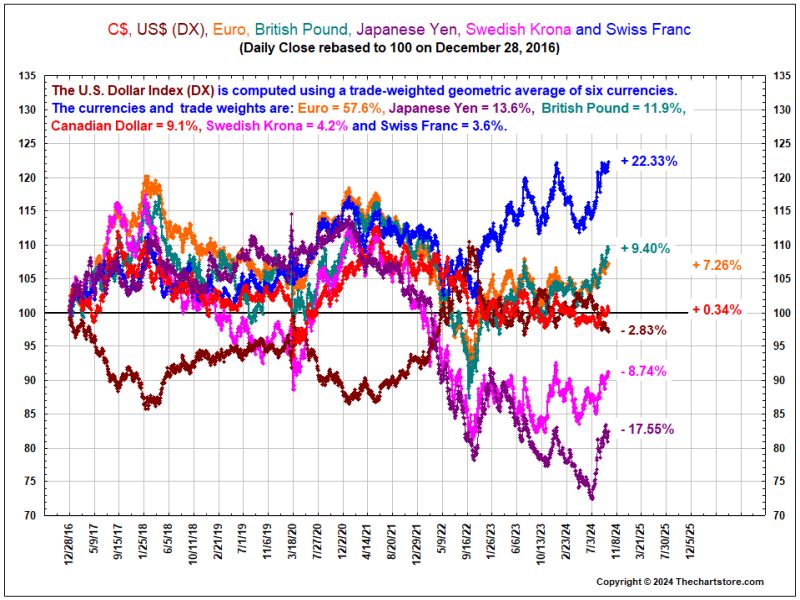
Chart 70
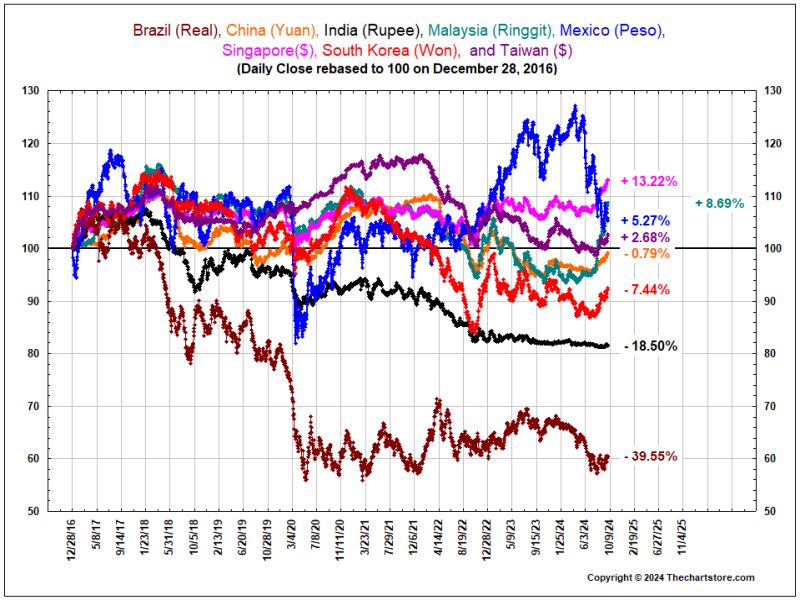
Chart 71
Chart 72
Chart 73
Chart 74
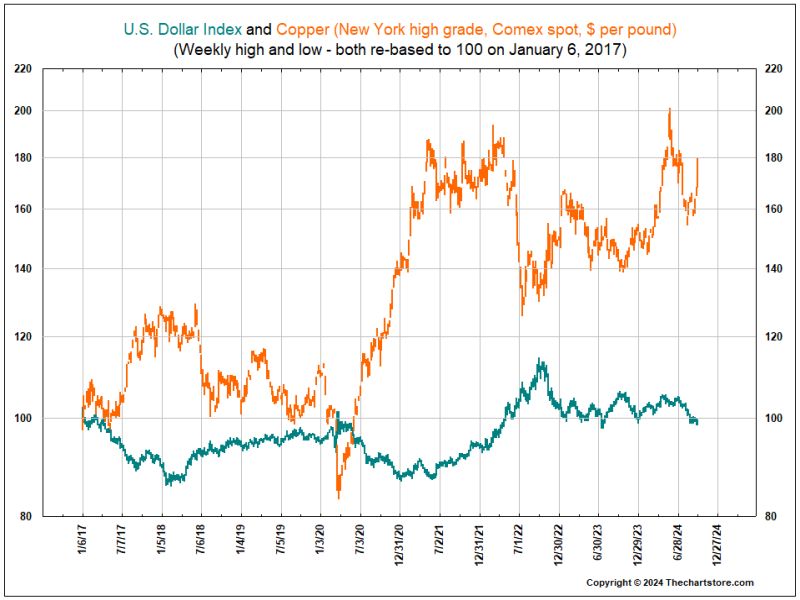
Commodity Watch
Chart 75
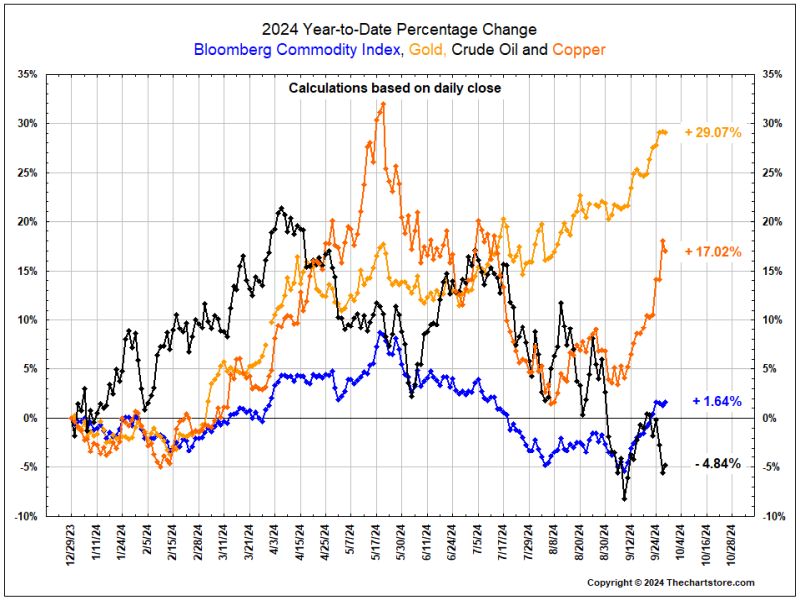
Chart 76
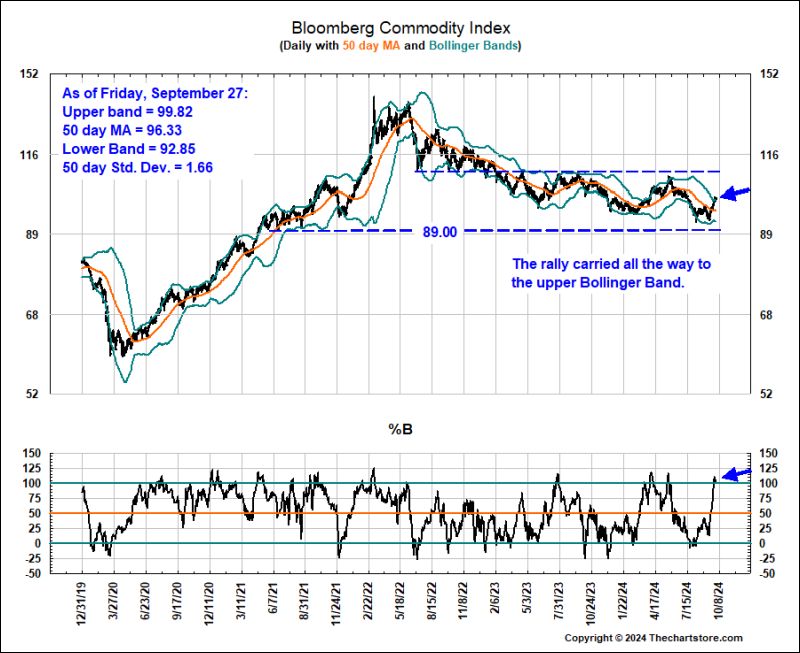
Chart 77
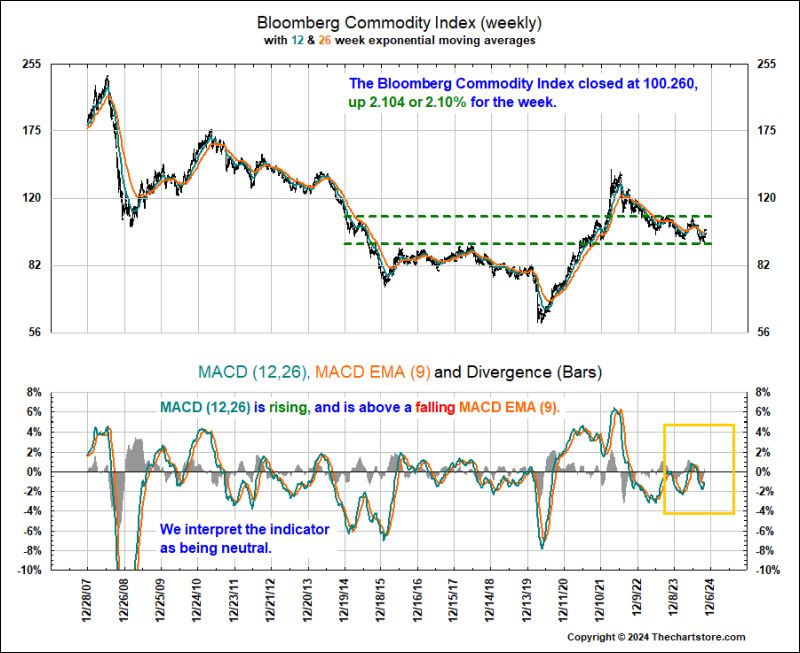
Chart 78
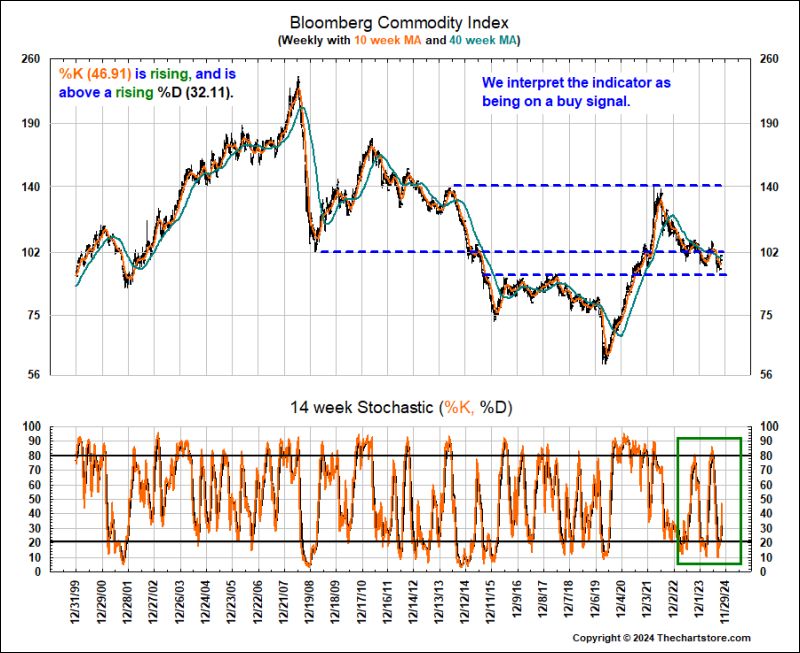
Chart 79
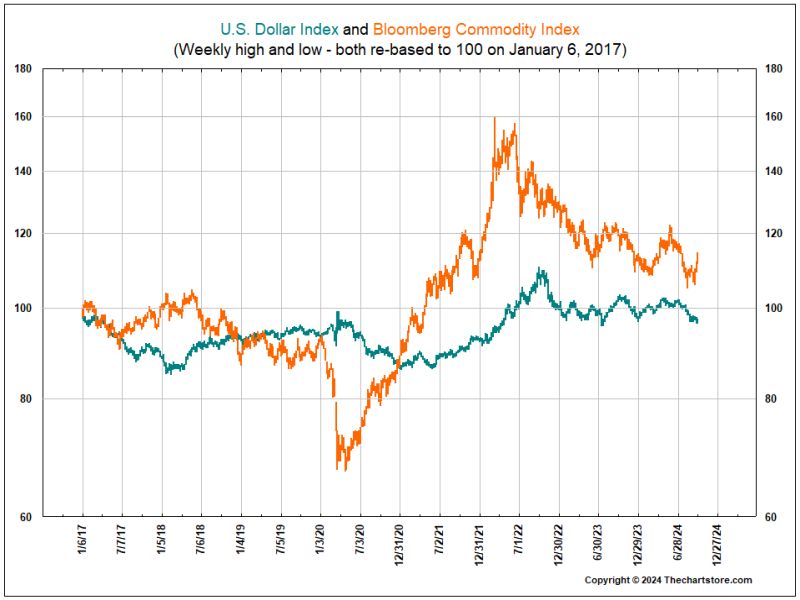
Chart 80
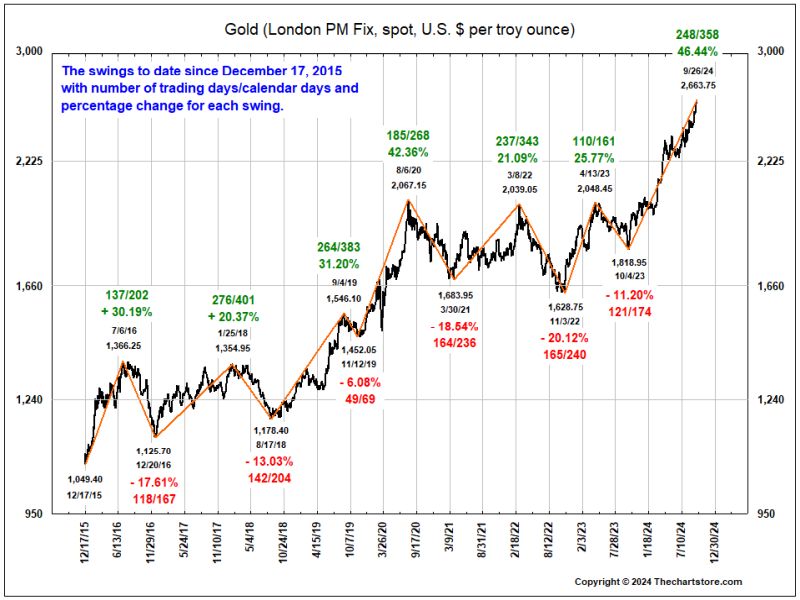
Chart 81
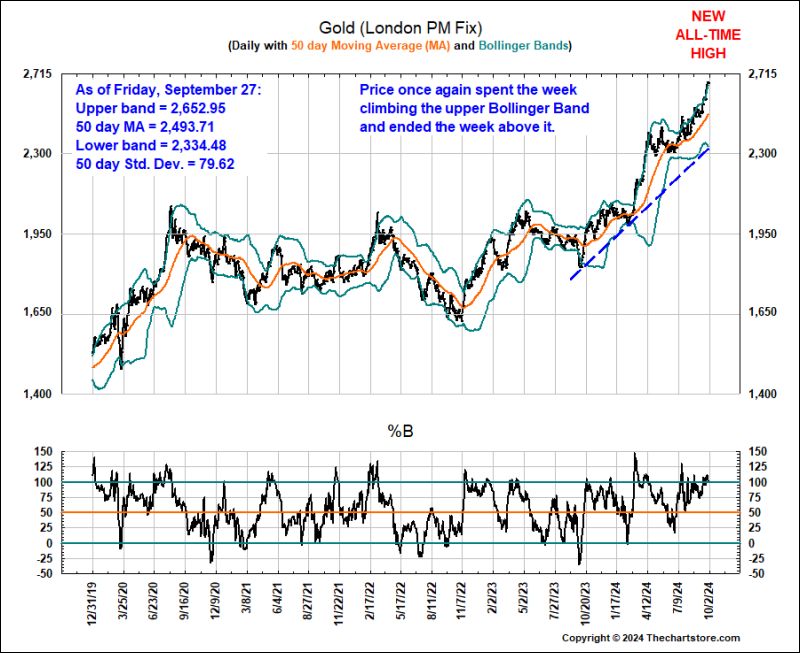
Chart 82
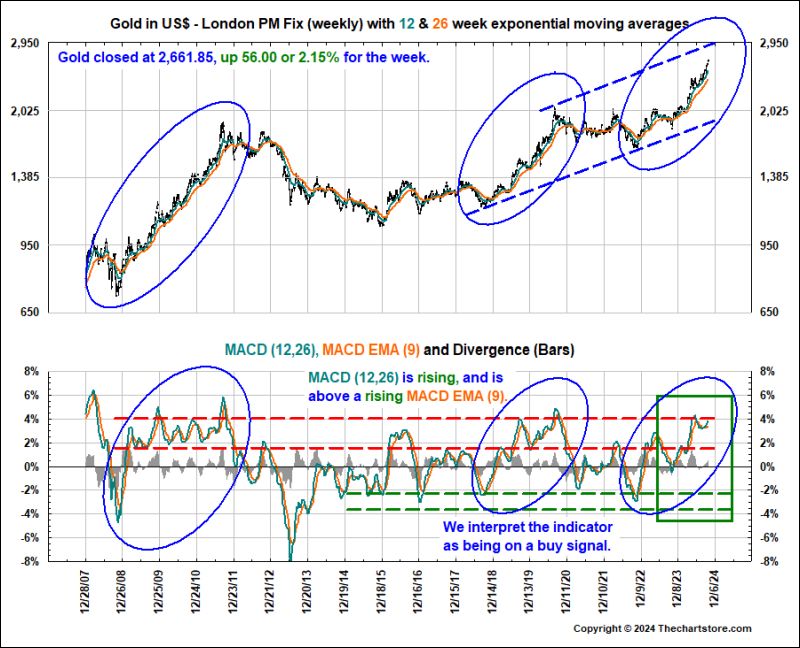
Chart 83
Chart 84
Chart 85
Chart 86
Chart 87
Chart 88
Chart 89
Chart 90
Chart 91
Chart 92
Chart 93
Chart 94
Chart 95
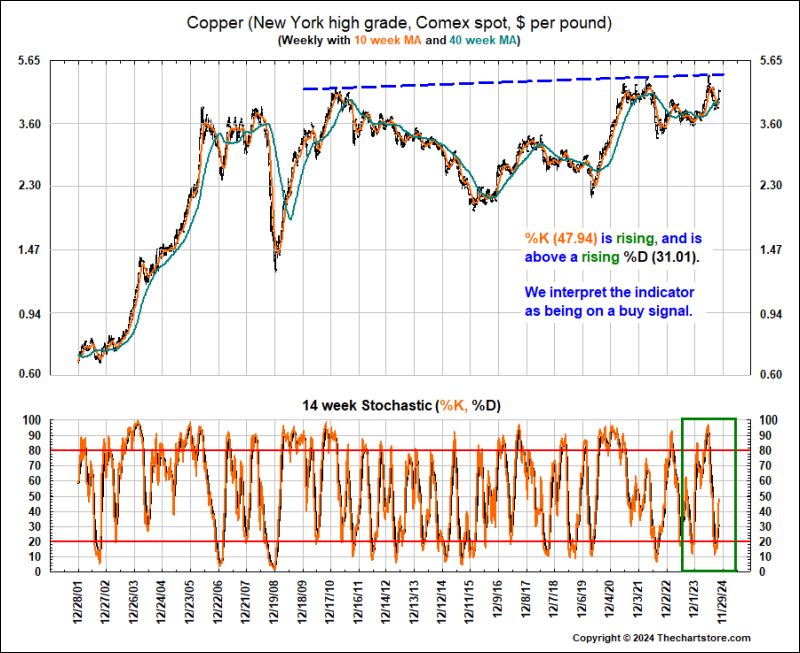
Chart 96
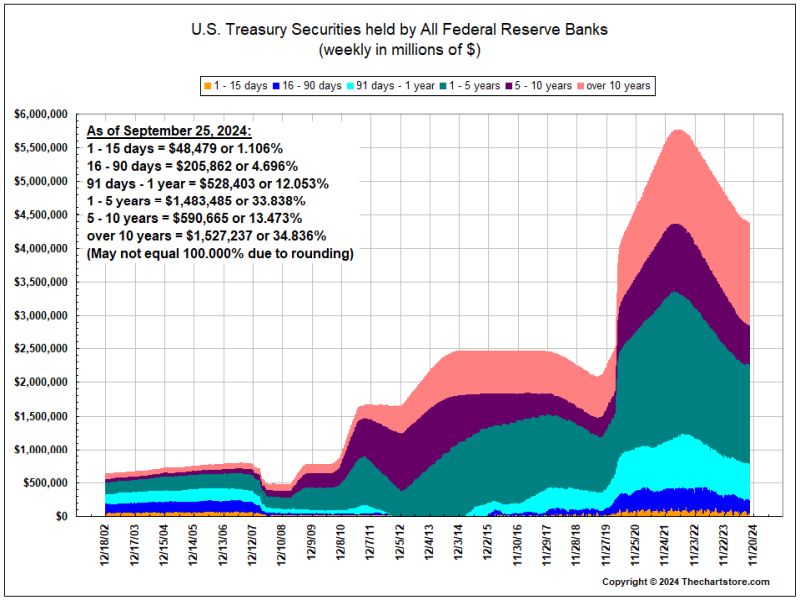
Fed Watch
Chart 97
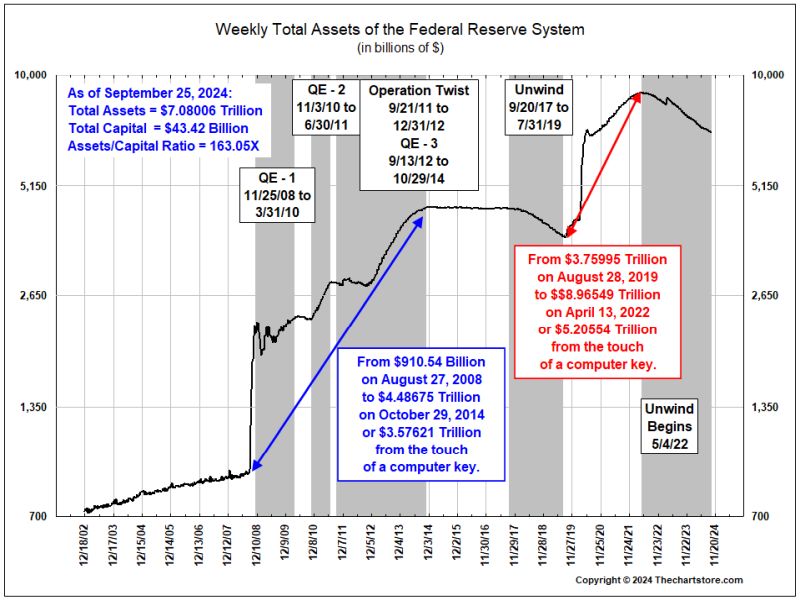
Chart 98
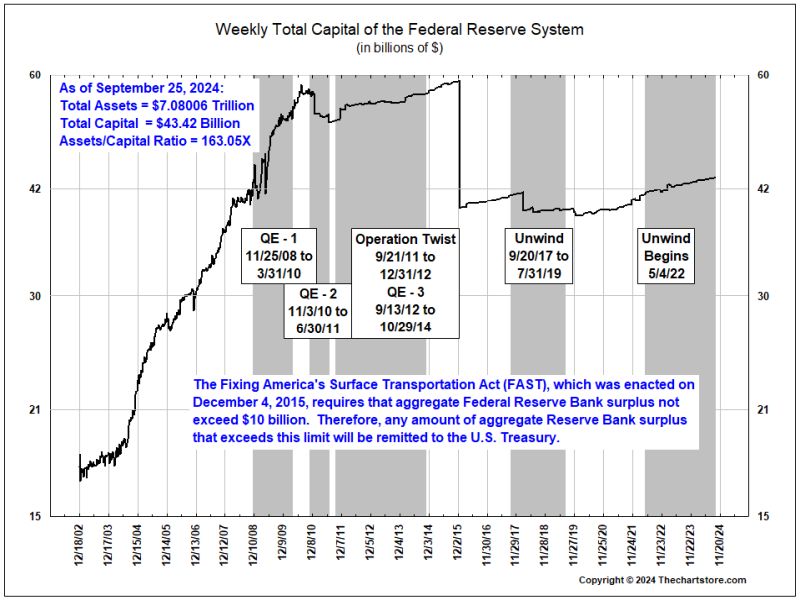
Chart 99
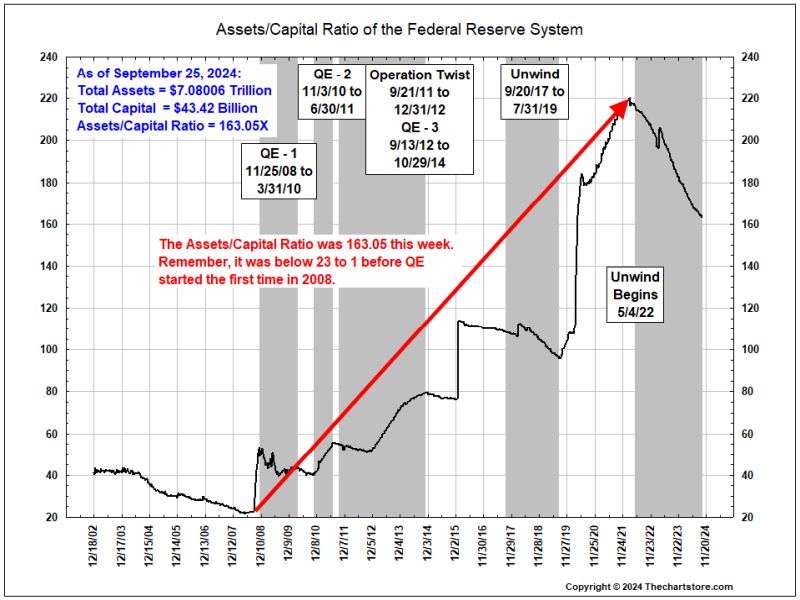
Chart 100
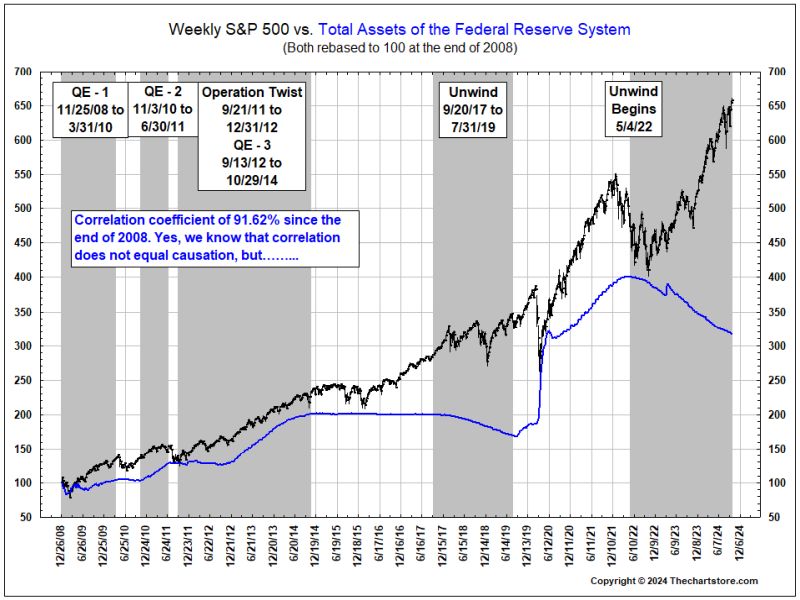
Chart 101
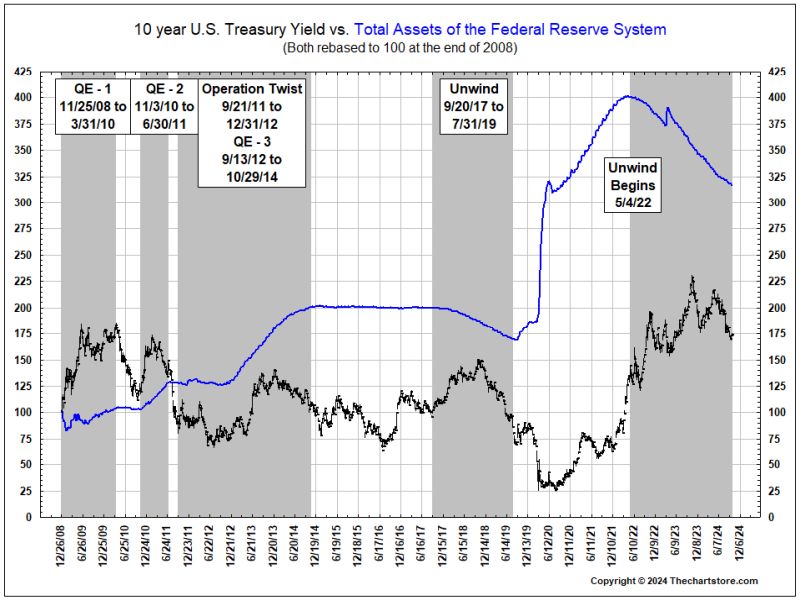
Chart 102
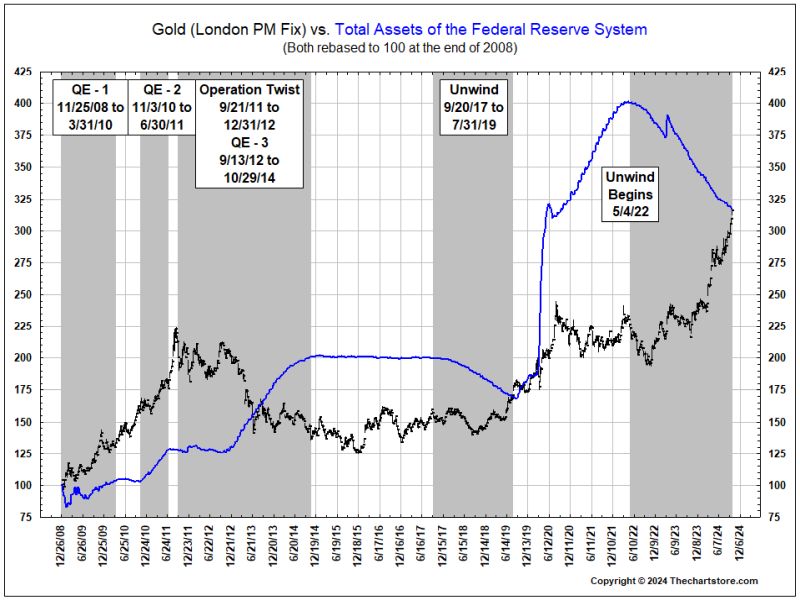
Chart 103
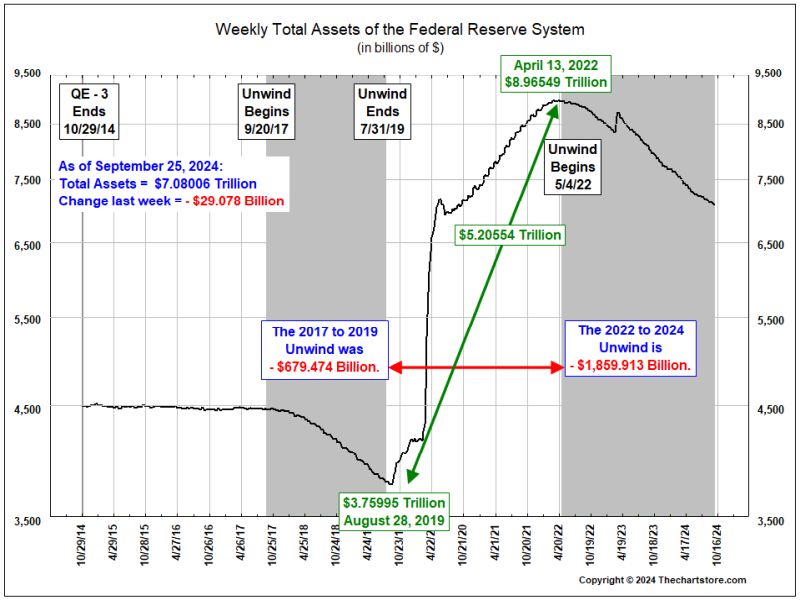
Chart 104
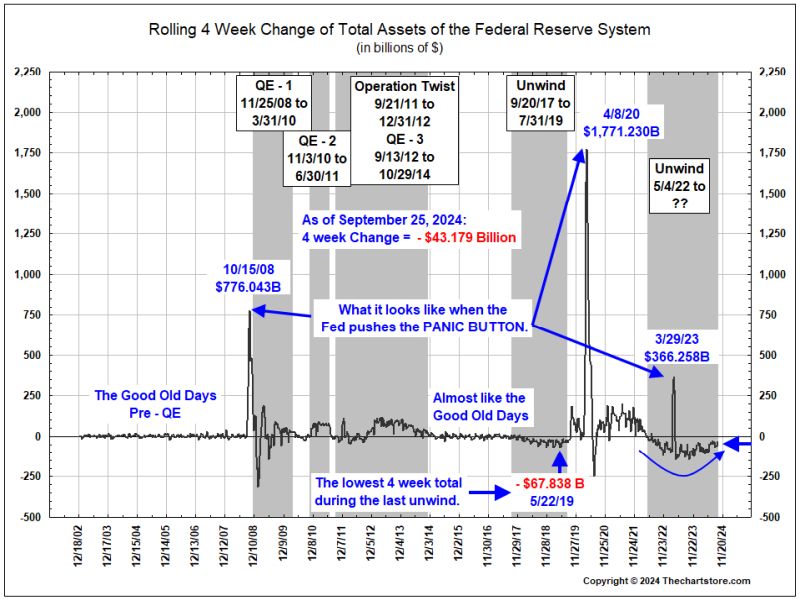
Chart 105

Chart 106
S&P CoreLogic Case-Shiller Monthly Home Price Indexes
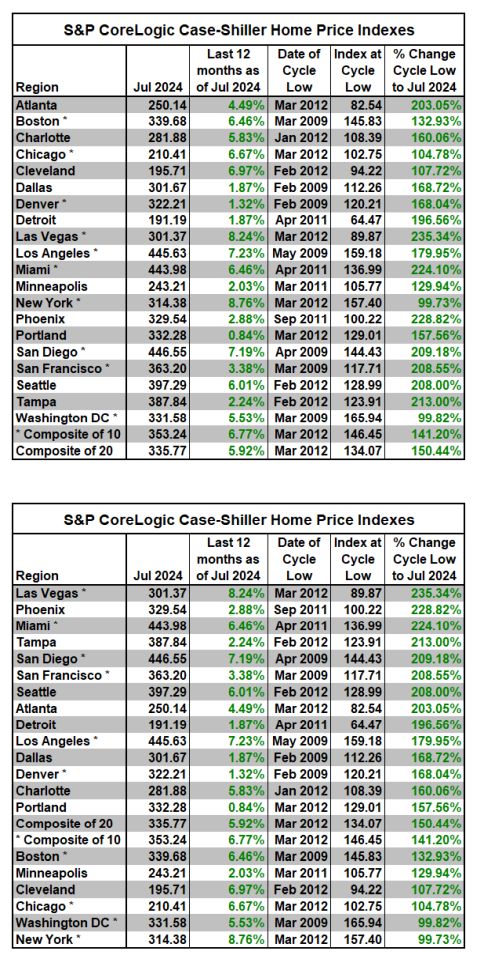
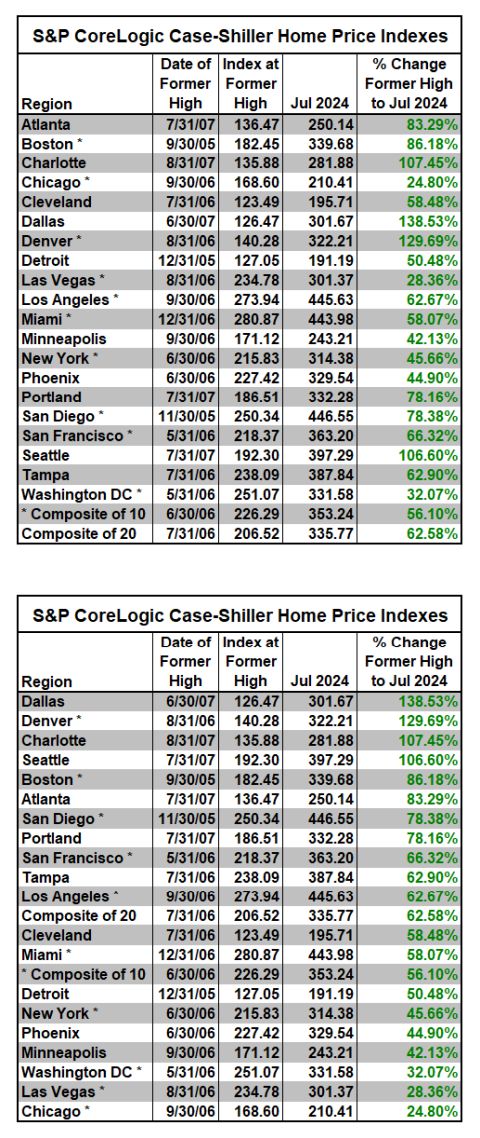
Chart 107
GDP Watch
Annual Update of the National Economic Accounts
Today’s release presents results from the annual update of the National Economic Accounts (NEAs), which include the National Income and Product Accounts (NIPAs) and the Industry Economic Accounts (IEAs). The update includes revised estimates for the first quarter of 2019 through the first quarter of 2024 and resulted in revisions to GDP, GDP by industry, GDI, and their major components. The reference year remains 2017.
With today's release, most data are available through BEA’s Interactive Data application on the BEA website (www.bea.gov). Refer to “Information on 2024 Annual Updates to the National, Industry, and State and Local Economic Accounts” for the complete table release schedule and a summary of results through 2023, which includes information on methodology changes. A table showing the major current dollar revisions and their sources for each component of GDP, national income, and personal income is also provided. An article describing the update in more detail will be forthcoming in the Survey of Current Business.
The updated estimates show that real GDP increased at an average annual rate of 2.3 percent from 2018 to 2023, 0.2 percentage point higher than the previously published estimate. Over the same period, real GDI increased at an average annual rate of 2.2 percent, 0.4 percentage point higher than previously published. The average of real GDP and real GDI over the same period was 2.3 percent, 0.4 percentage point higher than previously published.
For the period of economic expansion from the second quarter of 2009 through the fourth quarter of 2019, real GDP increased at an annual rate of 2.5 percent, revised up 0.1 percentage point from the previously published estimates. For the period of economic contraction from the fourth quarter of 2019 through the second quarter of 2020, real GDP decreased at an annual rate of 17.5 percent, the same as previously estimated. For the period of economic expansion from the second quarter of 2020 through the first quarter of 2024, real GDP increased at an annual rate of 5.2 percent, 0.3 percentage point higher than previously estimated.
Previously published estimates, which are superseded by today's release, are found in BEA’s archives.
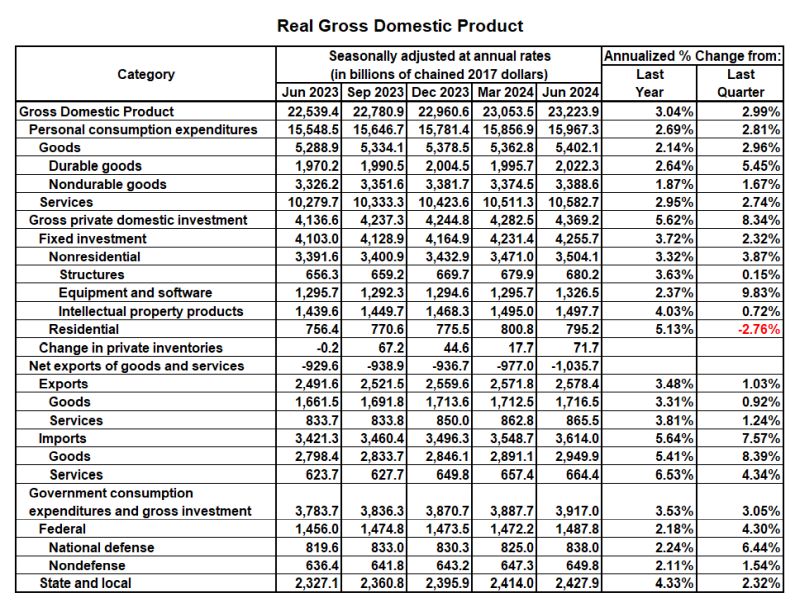

Chart 108
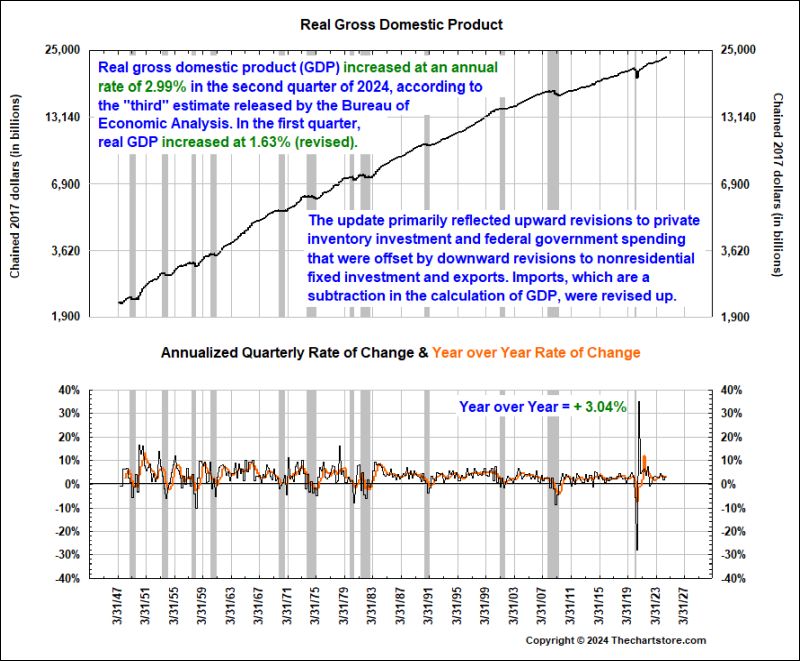
Chart 109
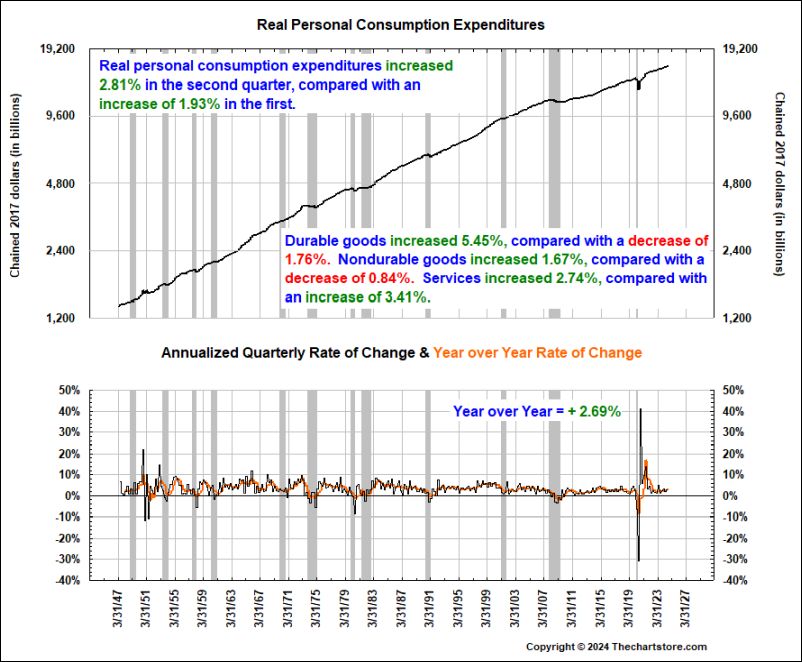
Chart 110
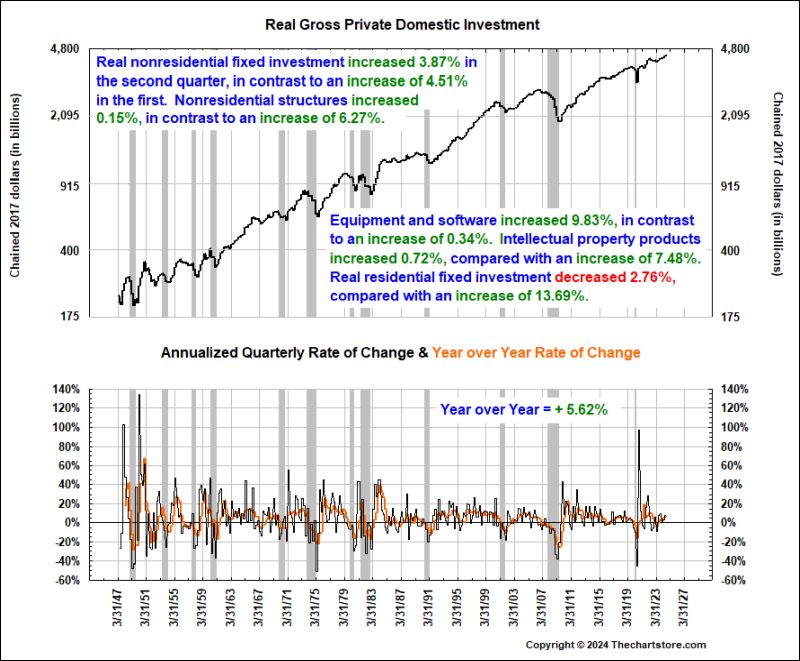
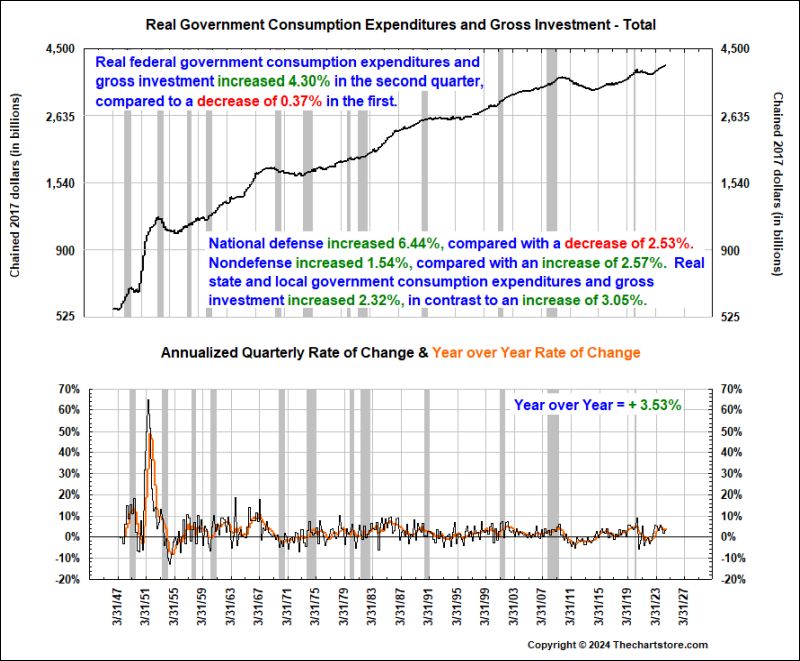
Chart 111
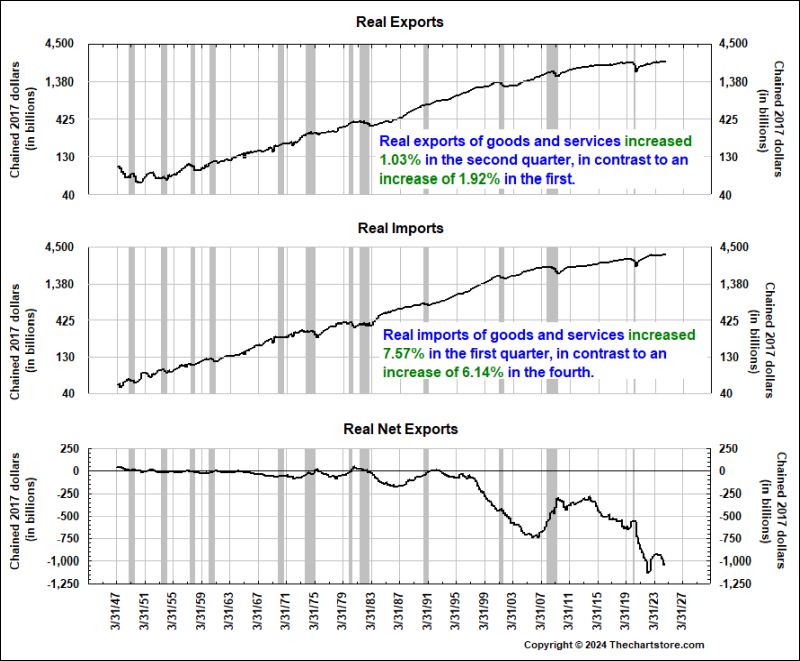
Chart 112
Personal Income and Outlays Watch
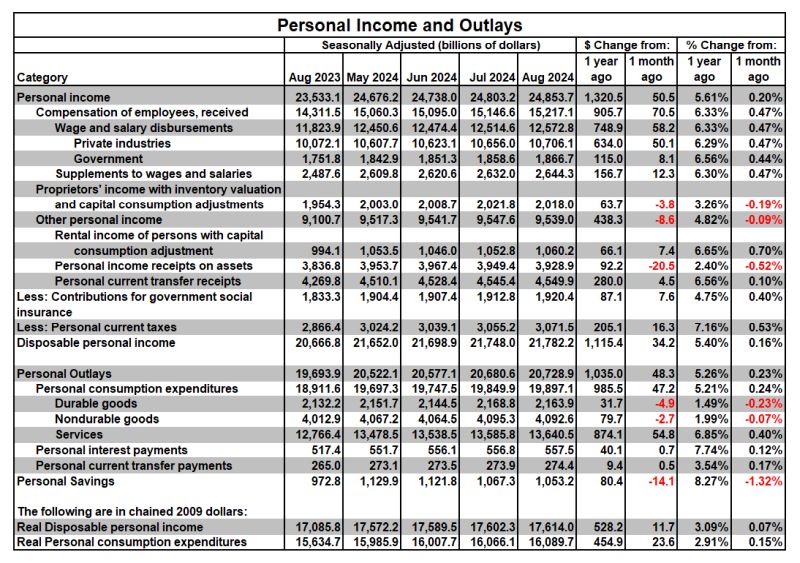
Chart 113
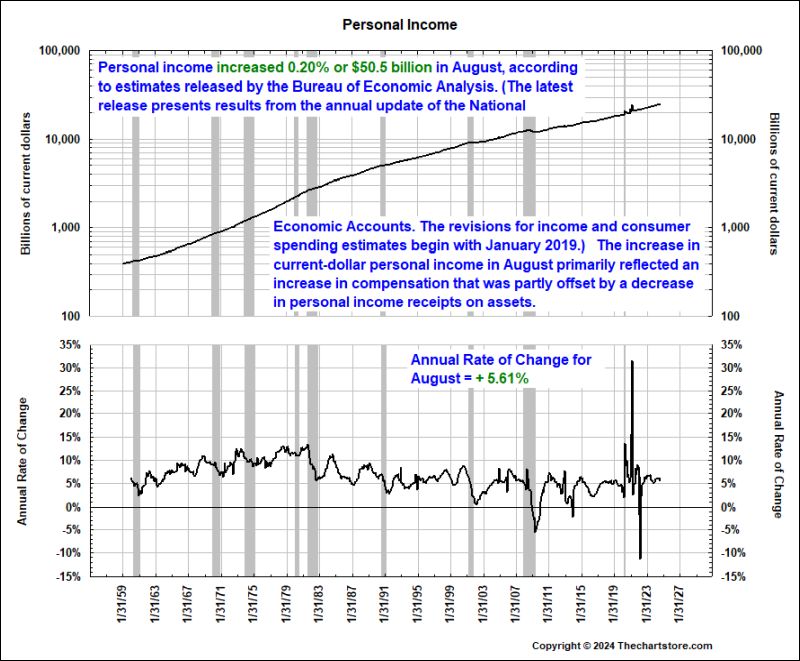
Chart 114
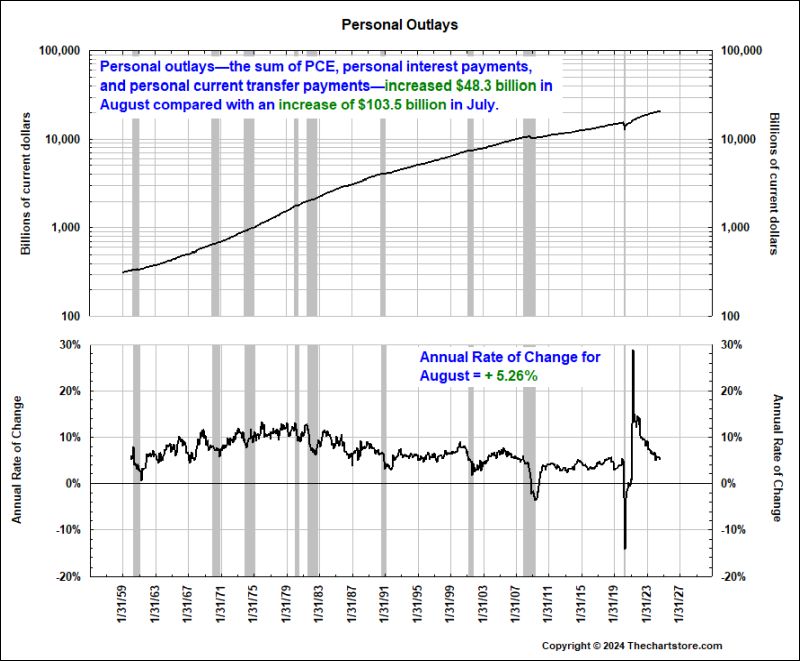
Chart 115
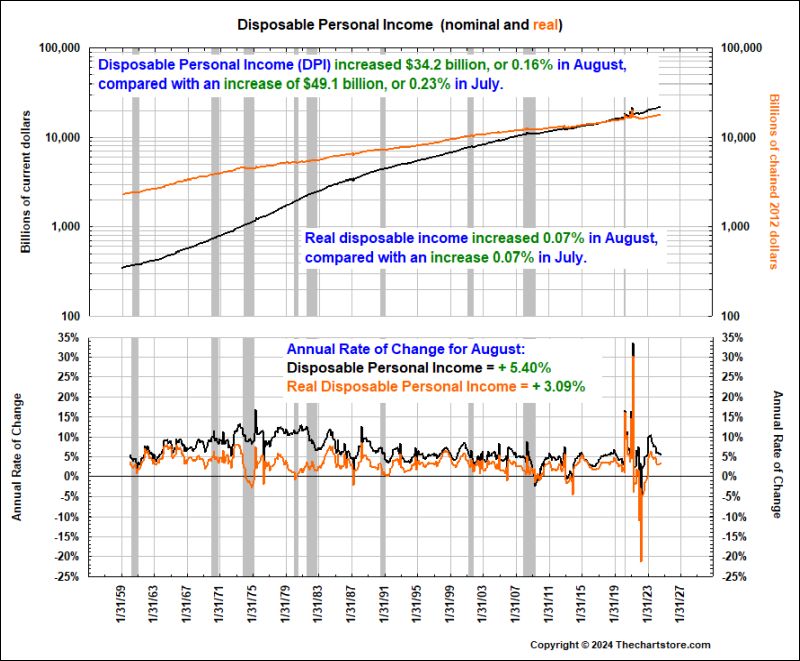
Chart 116
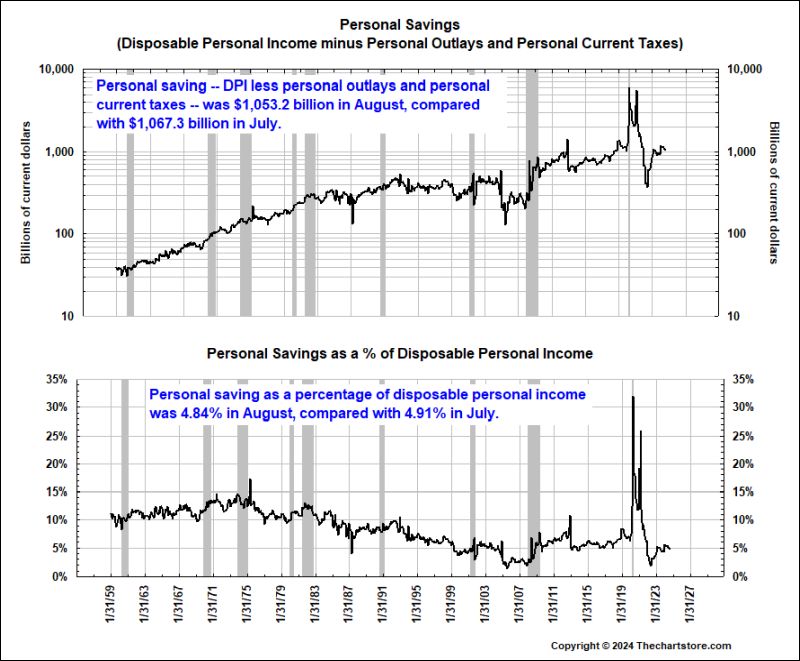
Chart 117

PCE and Other Inflation Watch
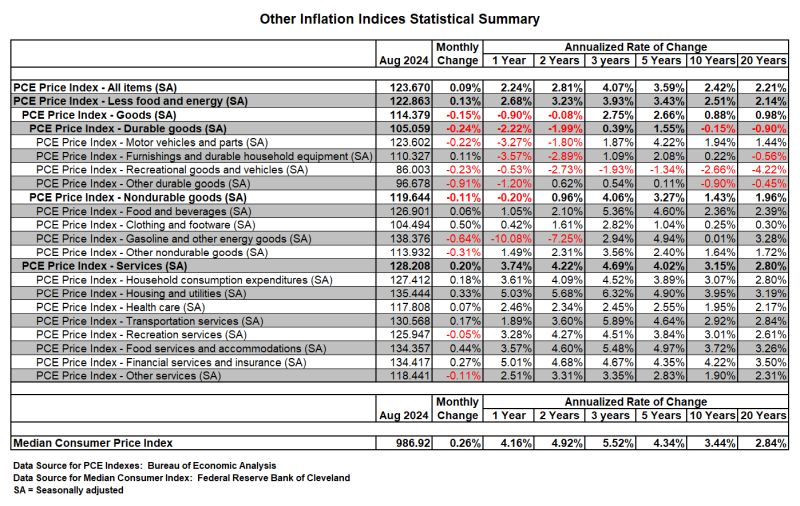
Chart 118
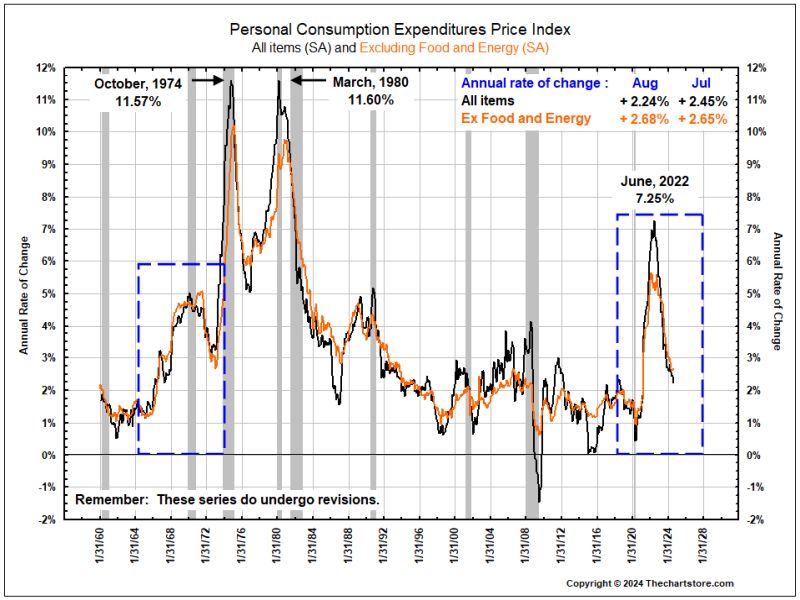
Chart 119
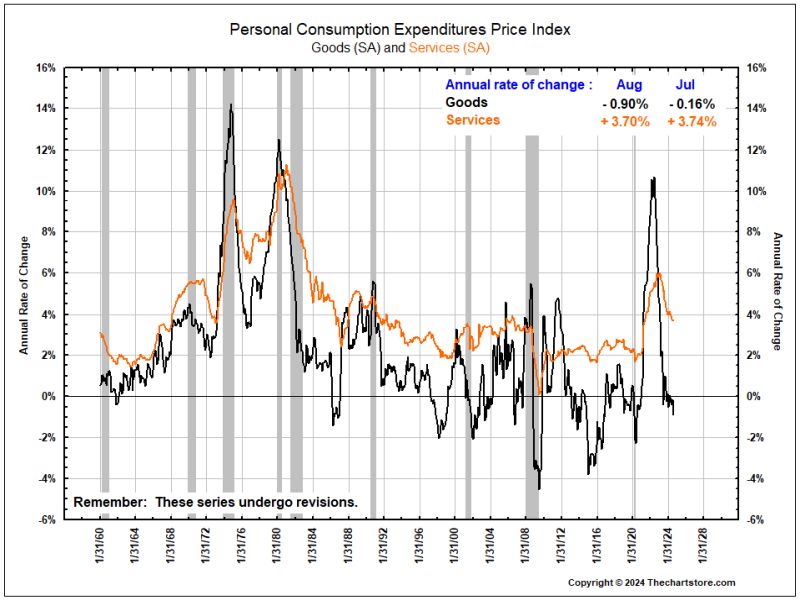
Chart 120
That's it for this week.....
To send us an email with a comment on this blog, click here.
Thechartstore.com does not promote the use of the information contained herein for any specific purpose, and makes no representations or warranties that the information contained in this publication is suitable for the particular purposes of the subscriber or any other party. Thechartstore.com assumes no responsibility or liability of any kind for the use of the information contained herein by the subscriber or any other party. Reproduction of any or all of the Weekly Chart Blog without prior permission is prohibited.