Thechartstore.com does not promote the use of the information contained herein for any specific purpose, and makes no representations or warranties that the information contained in this publication is suitable for the particular purposes of the subscriber or any other party. Thechartstore.com assumes no responsibility or liability of any kind for the use of the information contained herein by the subscriber or any other party. Reproduction of any or all of the Weekly Chart Blog without prior permission is prohibited.
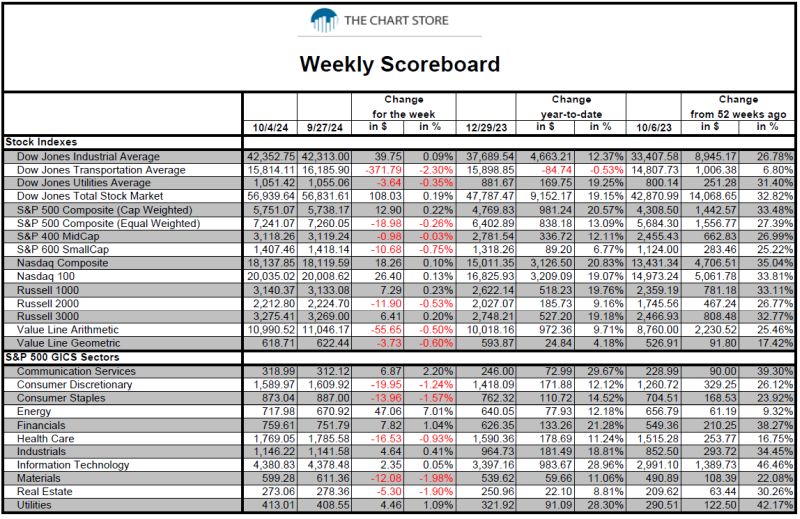
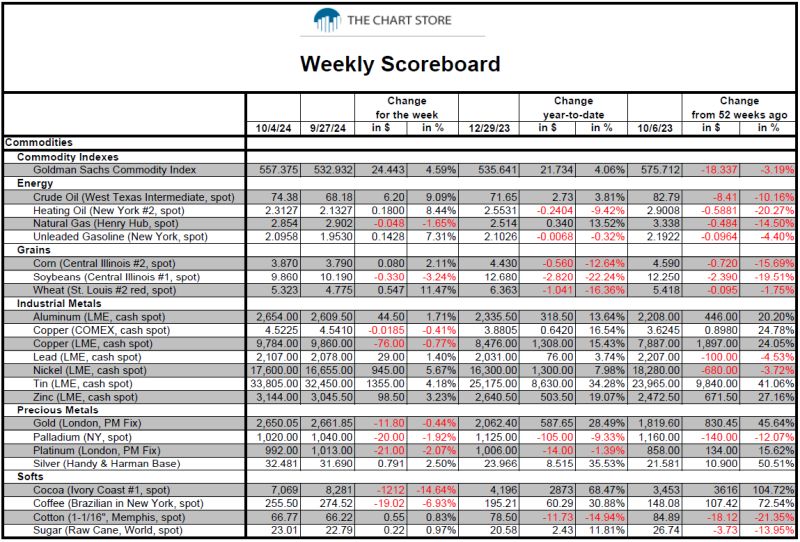
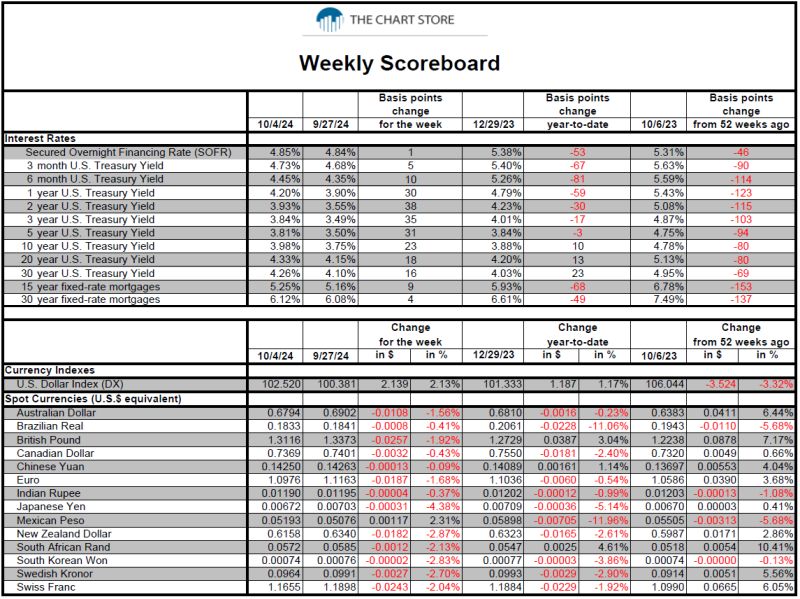
- The Weekly Scoreboard.
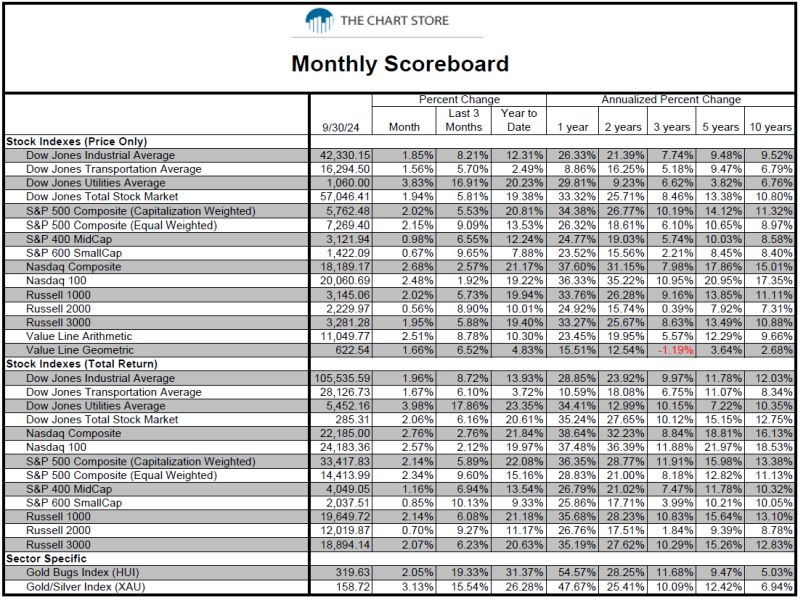
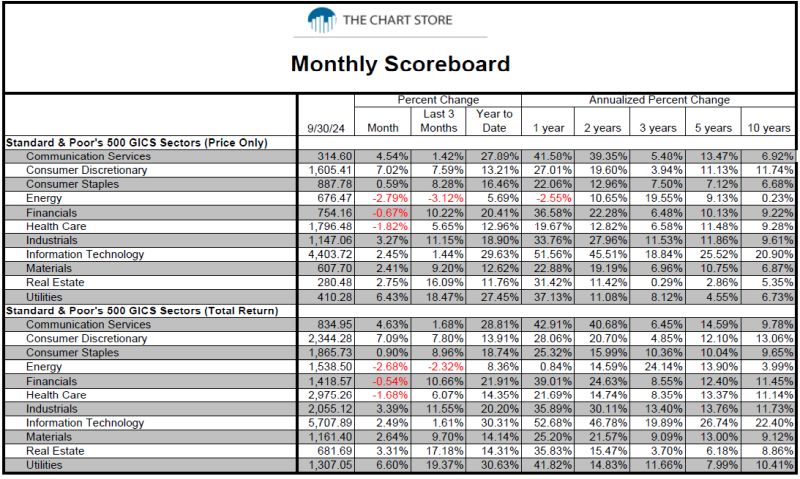
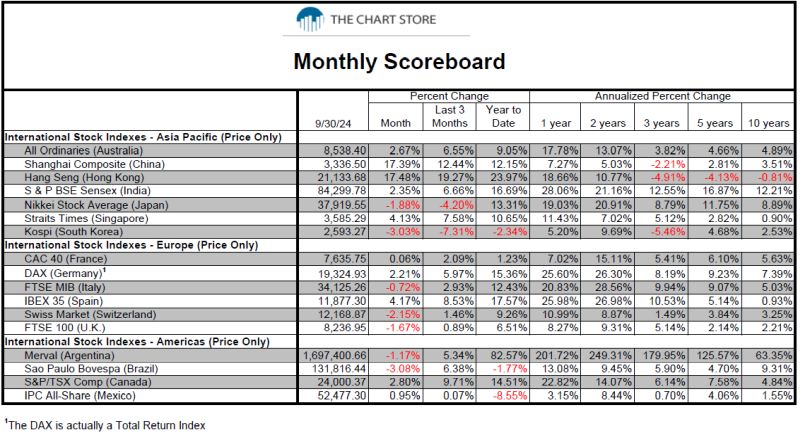
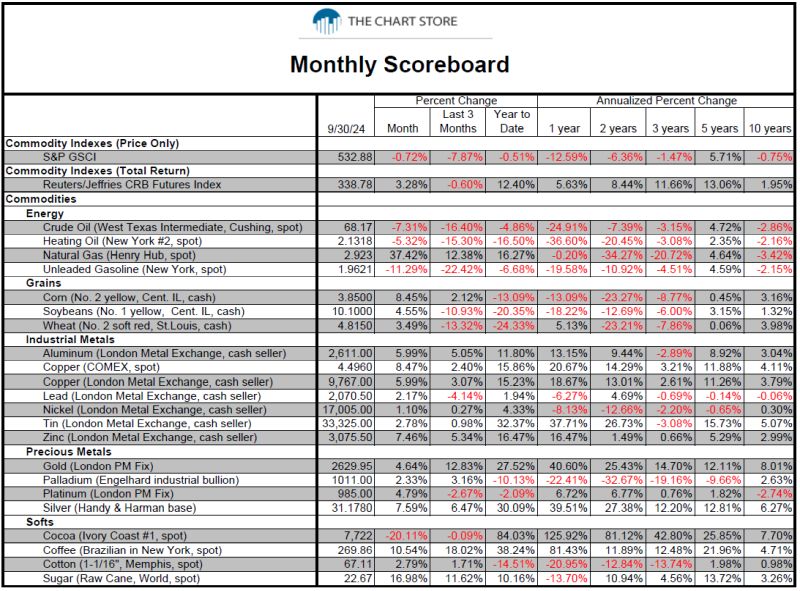
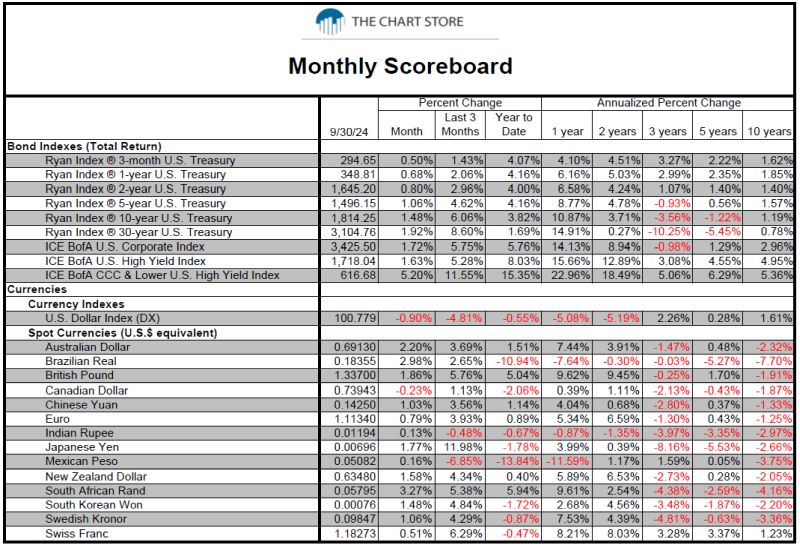
- The Monthly Scoreboard.
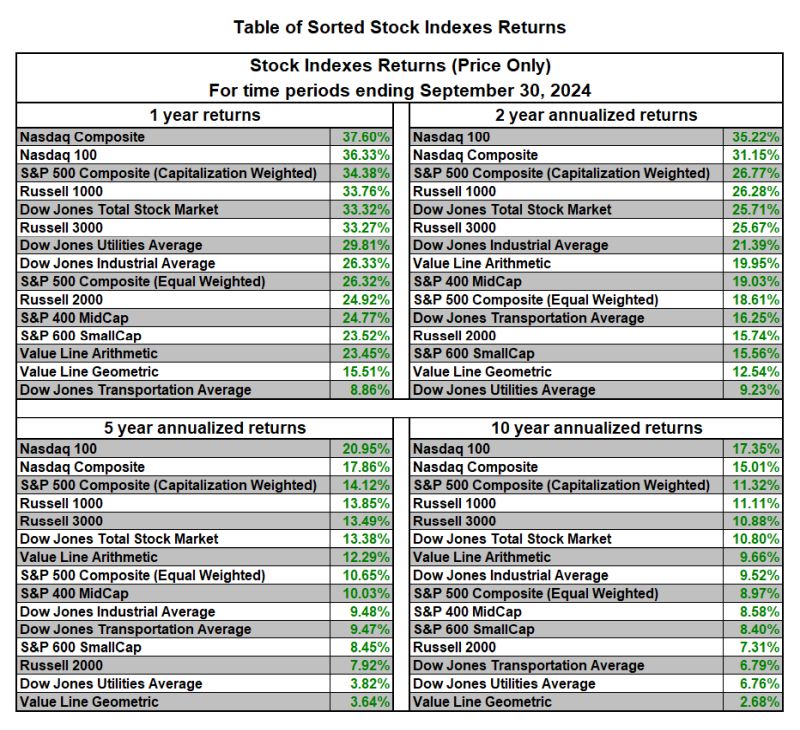
- Table of Sorted Stock Index (Price Only) Returns for 1 year, 2 years, 5 years and 10 years.
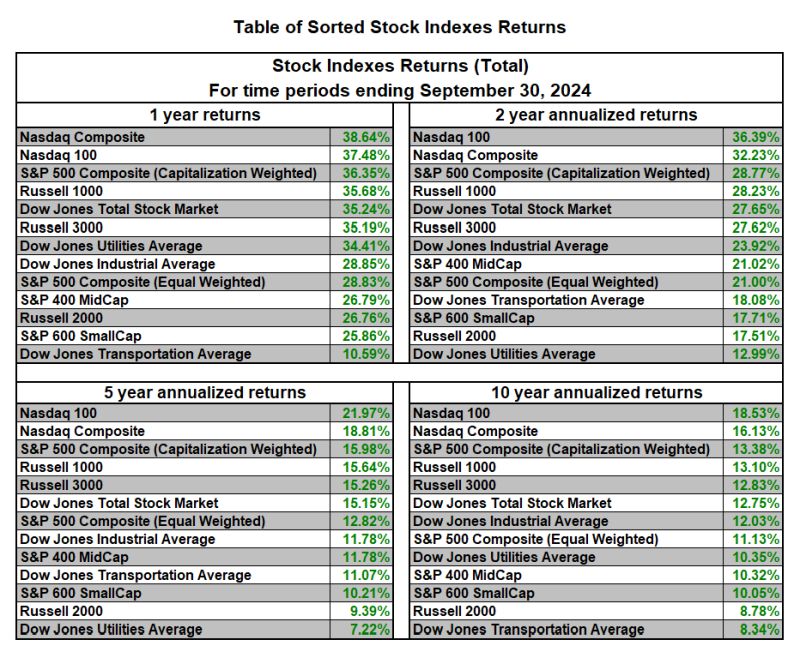
- Table of Sorted Stock Index (Total) Returns for 1 year, 2 years, 5 years and 10 years.
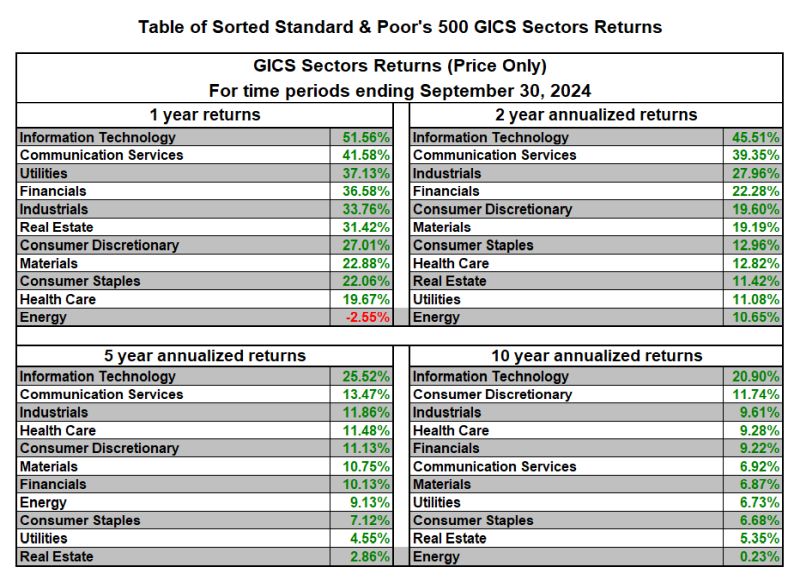
- Table of Sorted Standard & Poor's 500 GICS Sectors (Price Only) Returns for 1 year, 2 years, 5 years and 10 years.
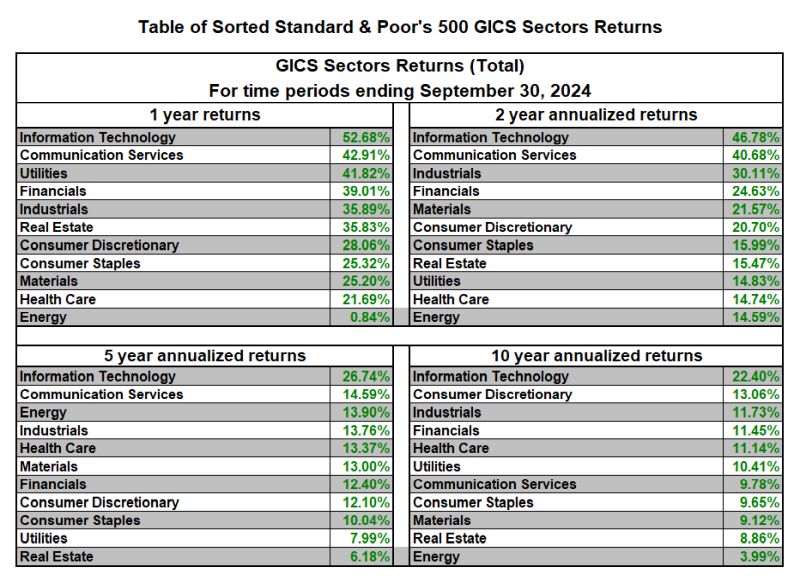
- Table of Sorted Standard & Poor's 500 GICS Sectors (Total) Returns for 1 year, 2 years, 5 years and 10 years.
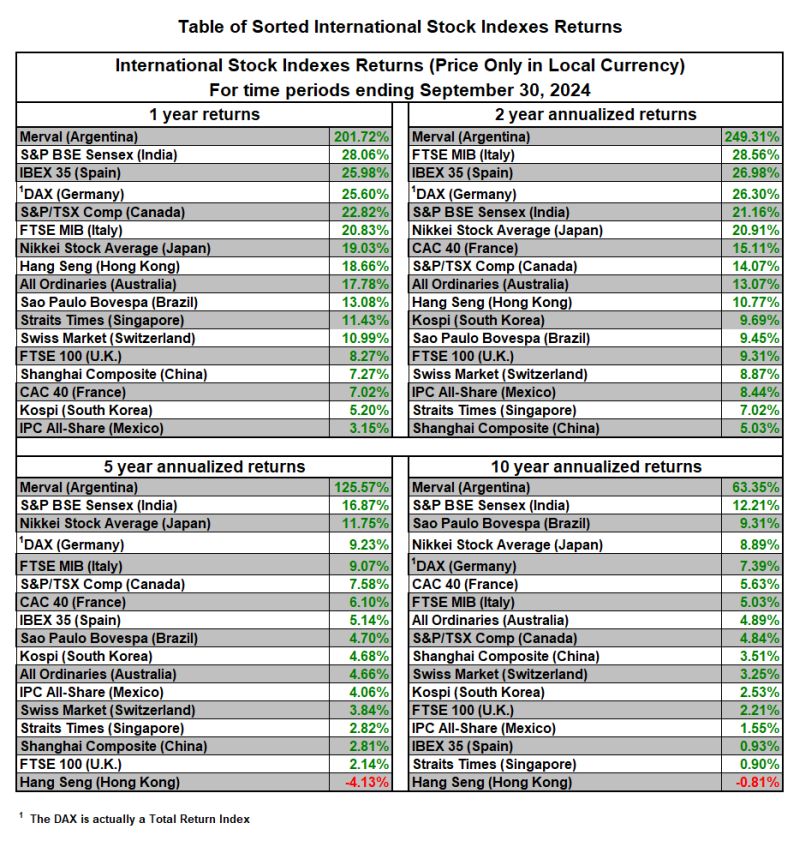
- Table of Sorted International Stock Indexes (Price Only) Returns for 1 year, 2 years, 5 years and 10 years.
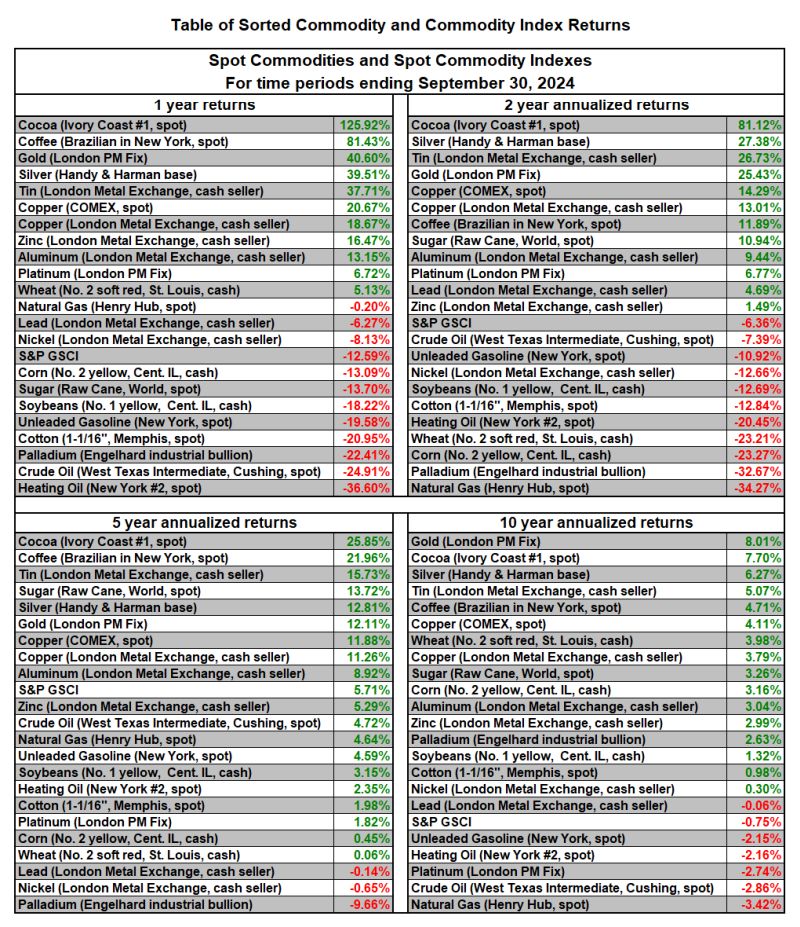
- Table of Sorted Commodity and Commodity Index Returns for 1 year, 2 years, 5 years and 10 years.
- Table of Sorted Bond Index Returns for 1 year, 2 years, 5 years and 10 years.
- Charts 1 through 11 - Major U.S. Stock Index Watch.
- Charts 12 through 22 - S&P GICS Sector Watch.
- Charts 23 through 36 - Stock Market Indicator Watch.
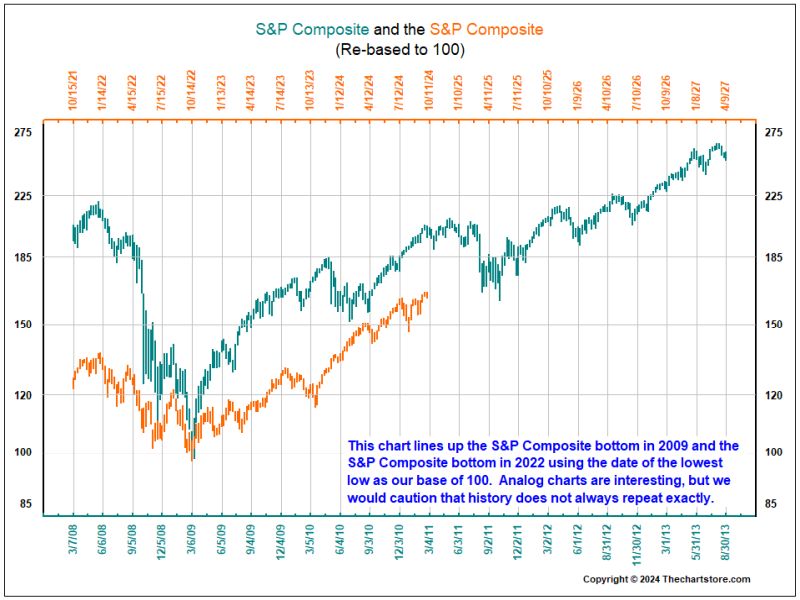
- Charts 37 through 46 - Analog Chart Watch.
- Charts 47 through 66 - Interest Rate Watch.
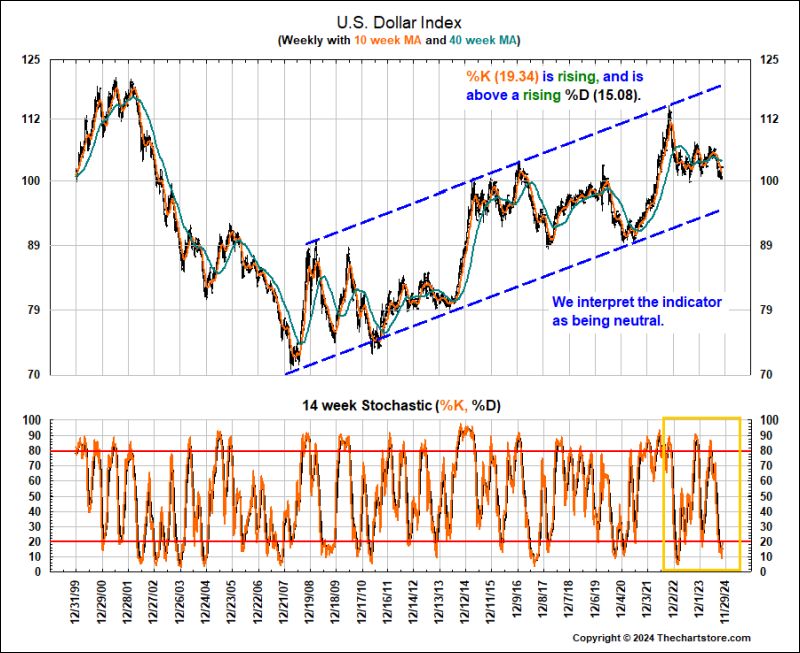
- Charts 67 through 74 - Currency Watch.
- Charts 75 through 96 - Commodity Watch.
- Charts 97 through 106 - Fed Watch.
- Charts 107 through 114 - Monthly Stochastics Watch.
- Charts 115 through 116 with Table - ISM Manufacturing Purchasing Manager's Index Watch.
- Charts 117 through 124 and Table - The Employment Situation Watch.
- Charts 125 through 129 and Table - Nonfarm Payroll Watch.
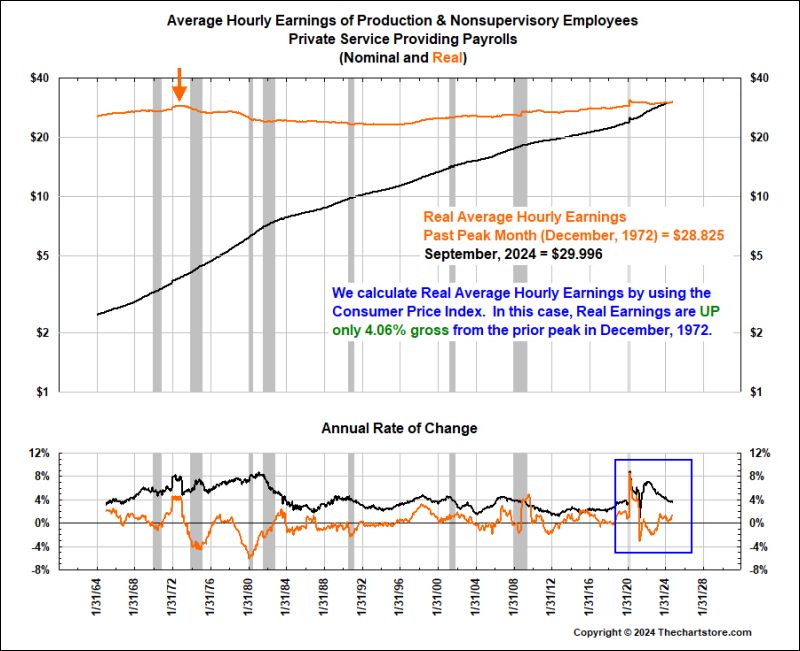
- Charts 130 through 132 and Table - Employee Compensation Watch.
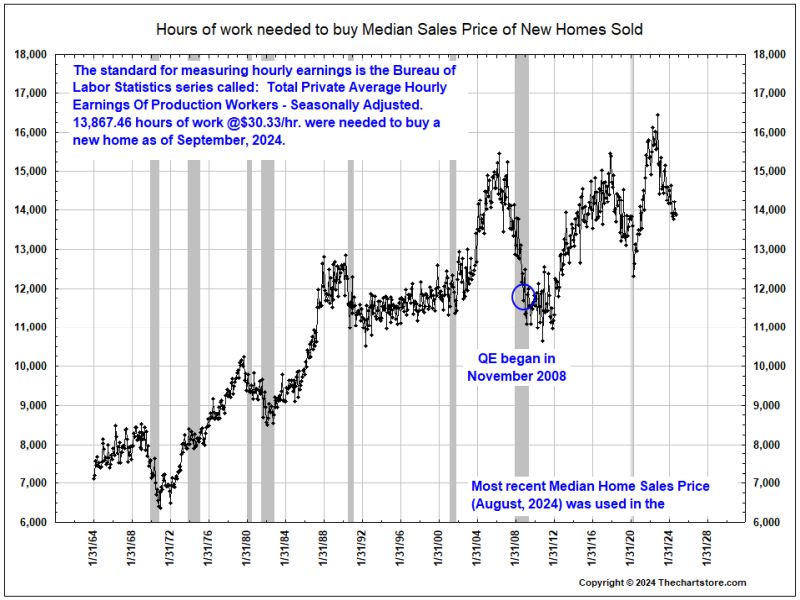
- Charts 133 through 141 - Hours of Work to Buy Watch.
For the Weekly Scoreboard in .pdf format, click here.
For the Monthly Scoreboard in .pdf format, click here.

Major U.S. Stock Index Watch
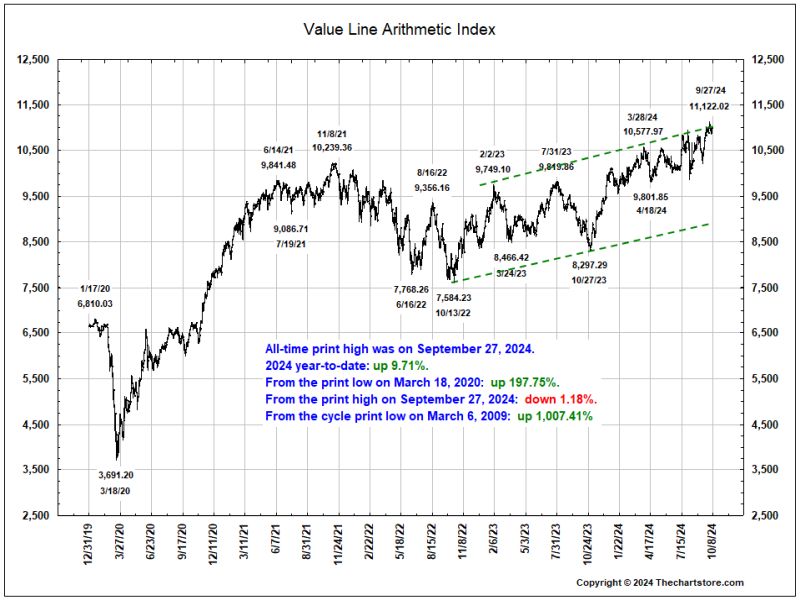
Chart 1
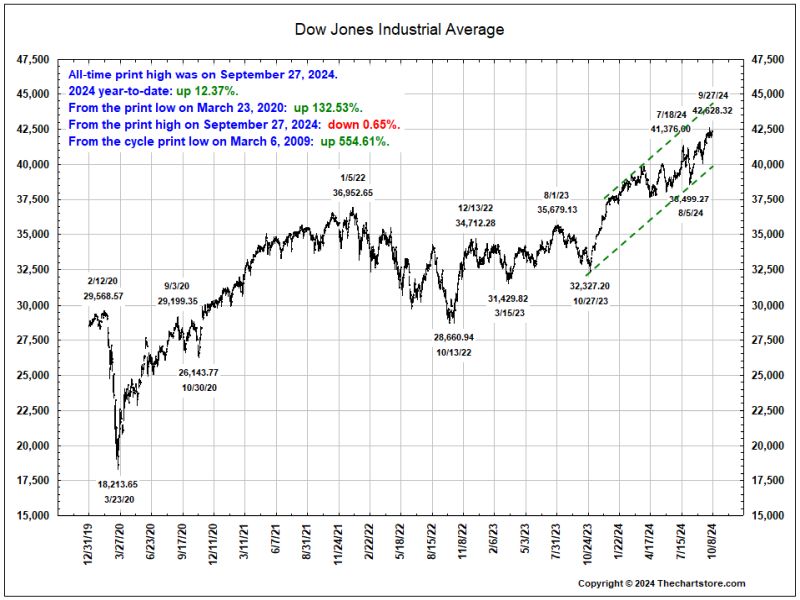
Chart 2
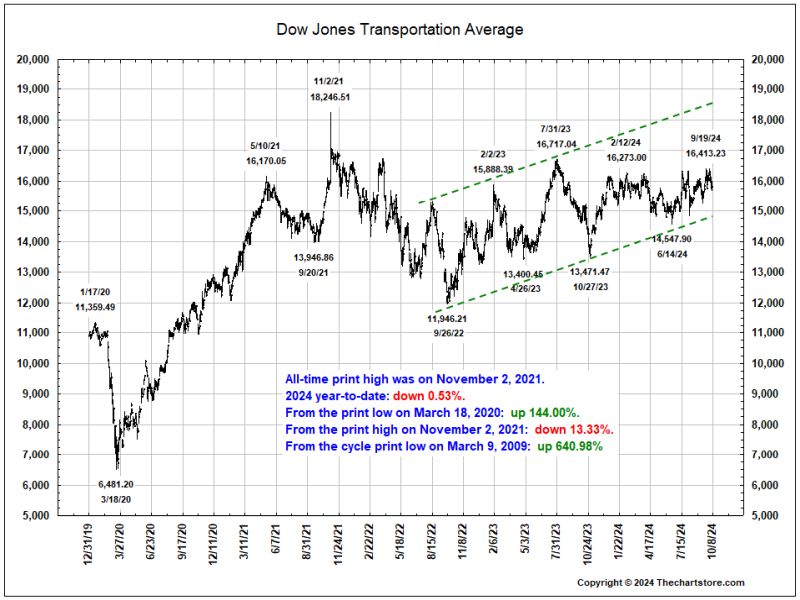
Chart 3
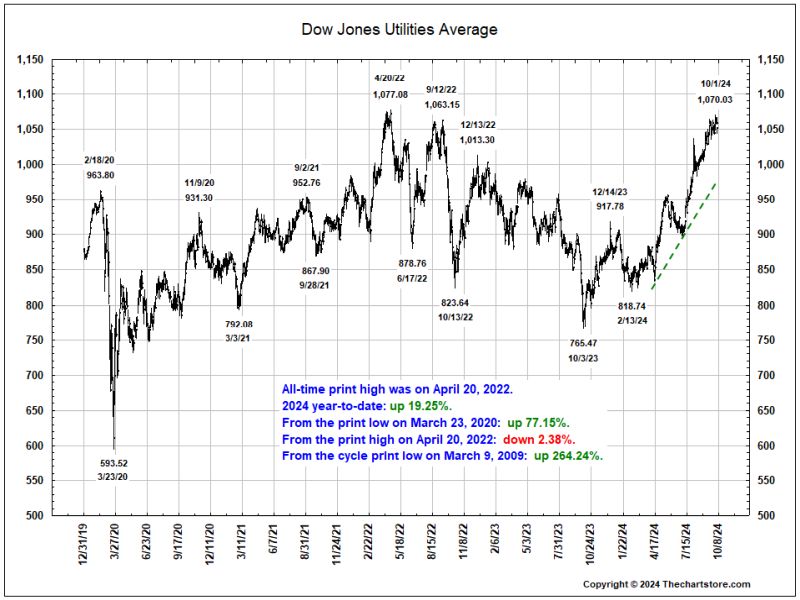
Chart 4
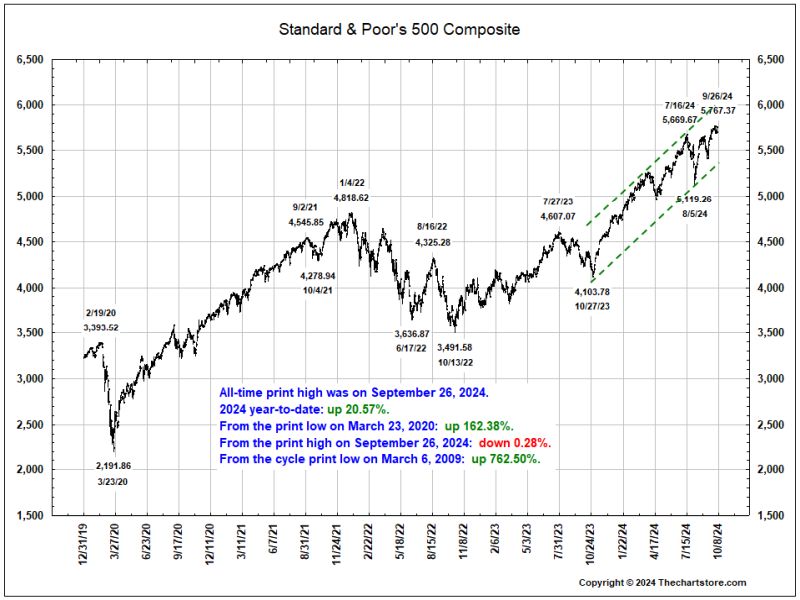
Chart 5
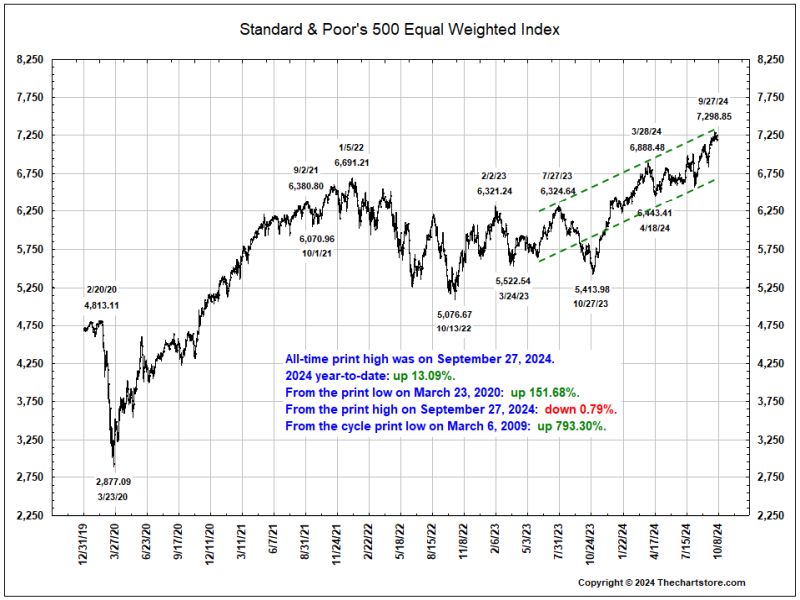
Chart 6
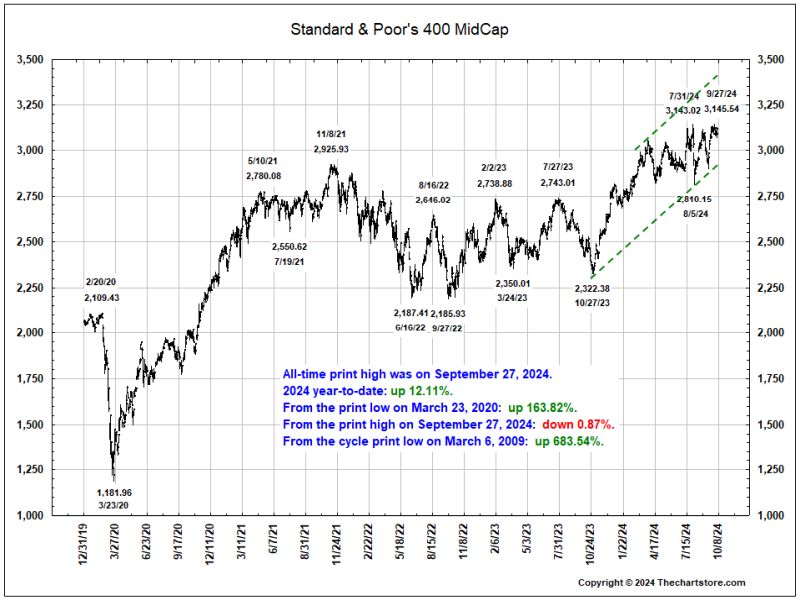
Chart 7
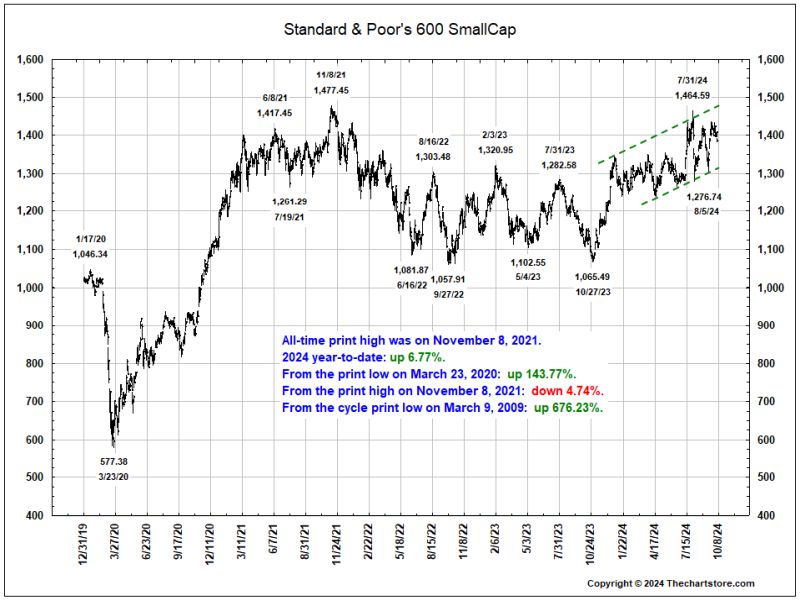
Chart 8
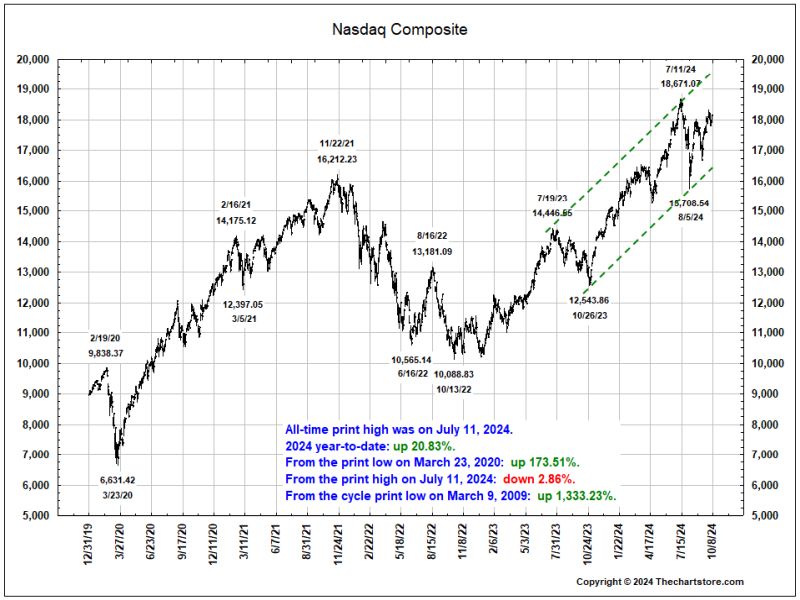
Chart 9
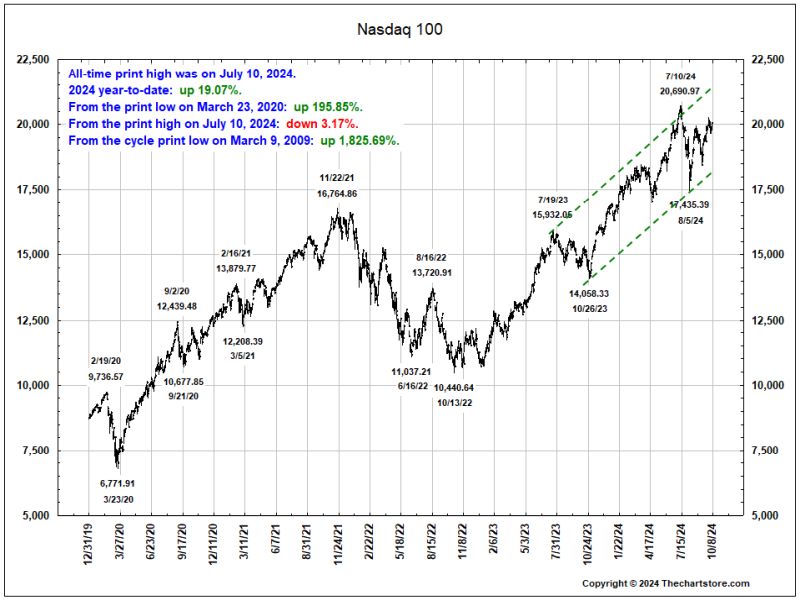
Chart 10
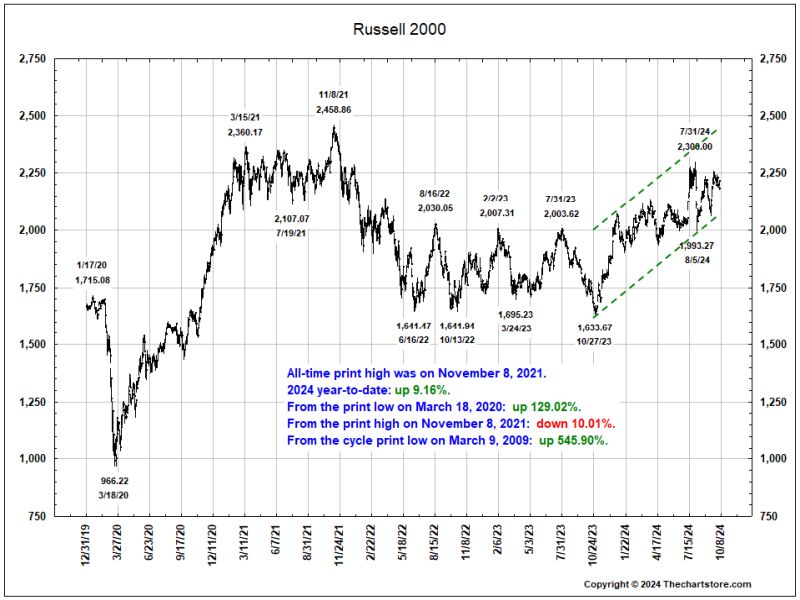
Chart 11
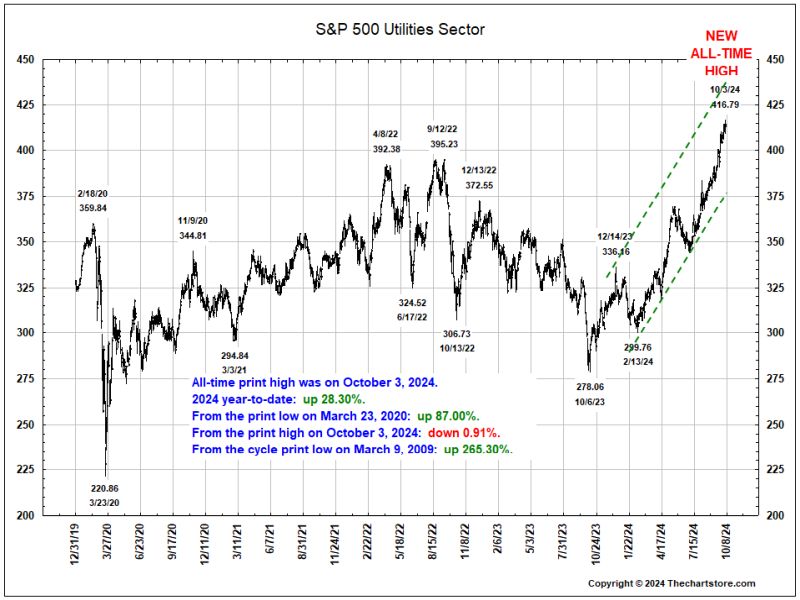
S&P GICS Sector Watch
Chart 12
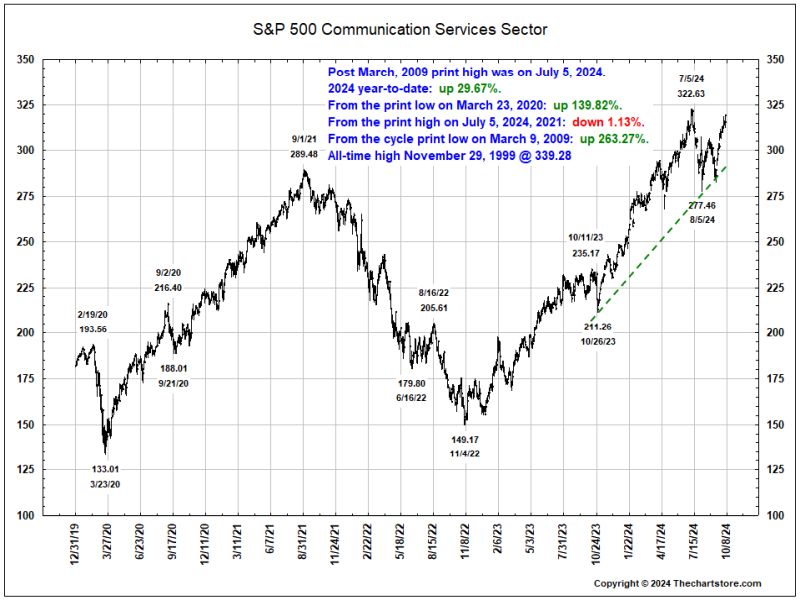
Chart 13
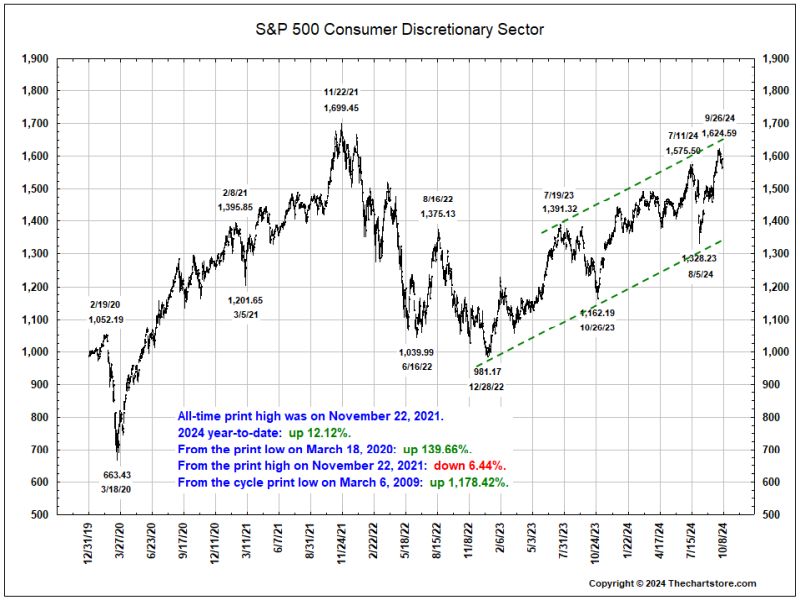
Chart 14
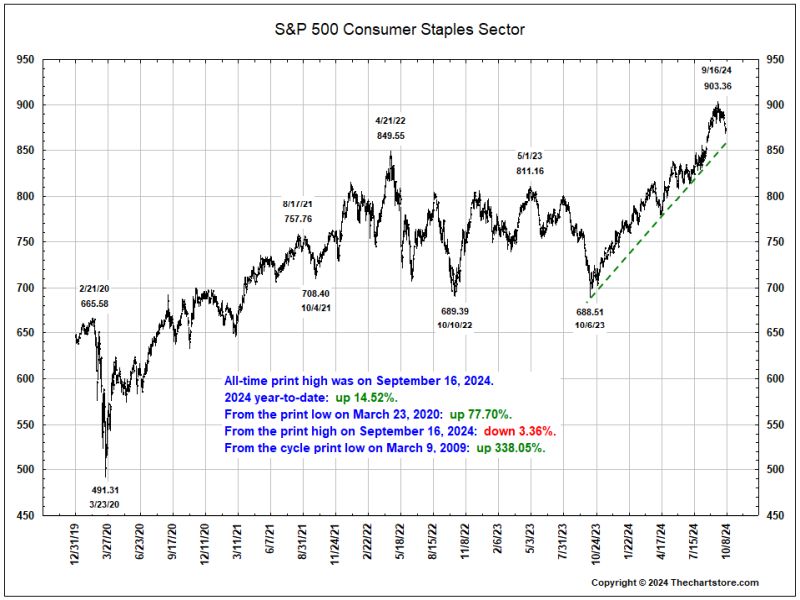
Chart 15
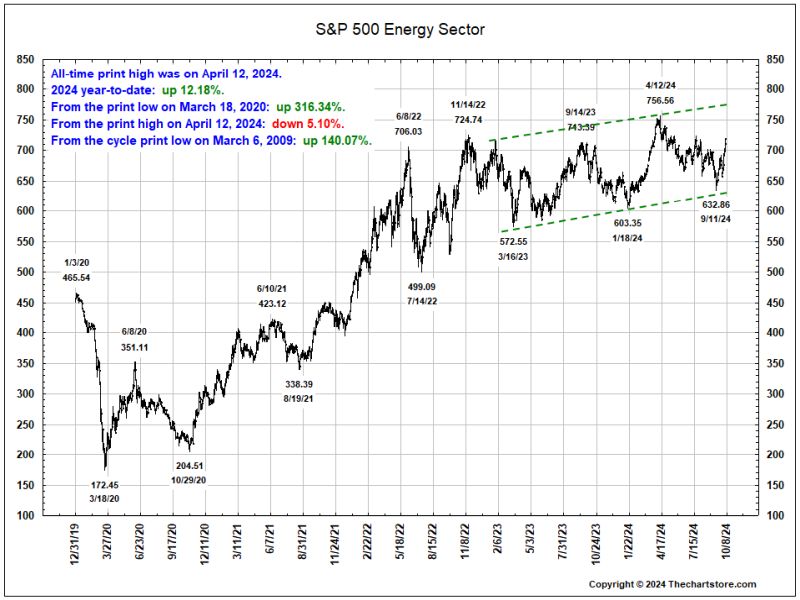
Chart 16
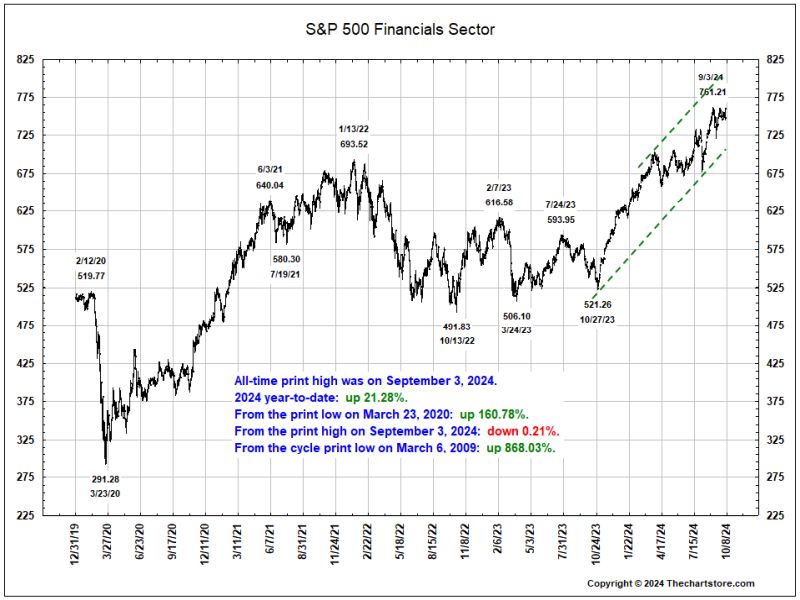
Chart 17
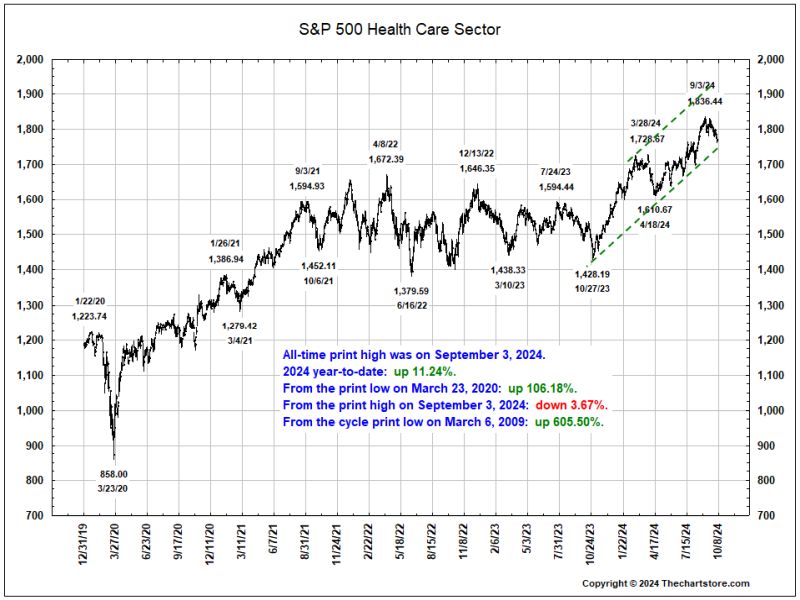
Chart 18
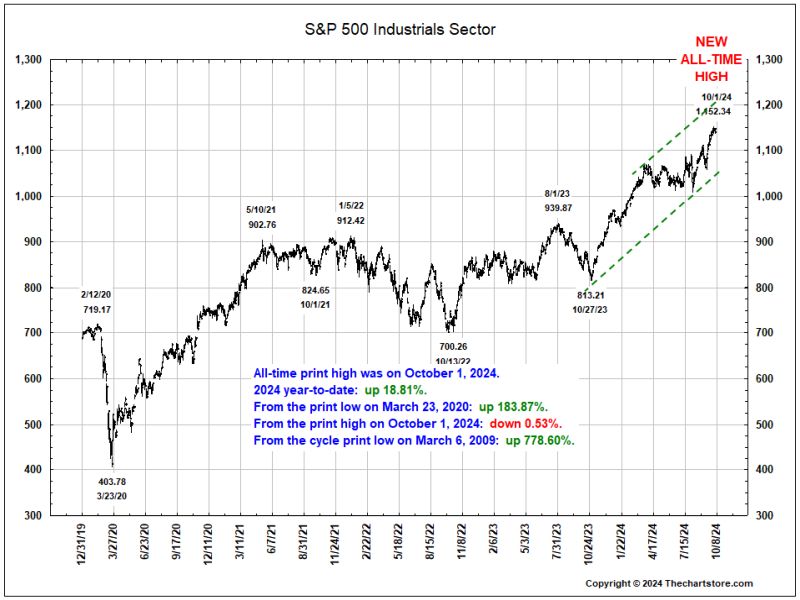
Chart 19
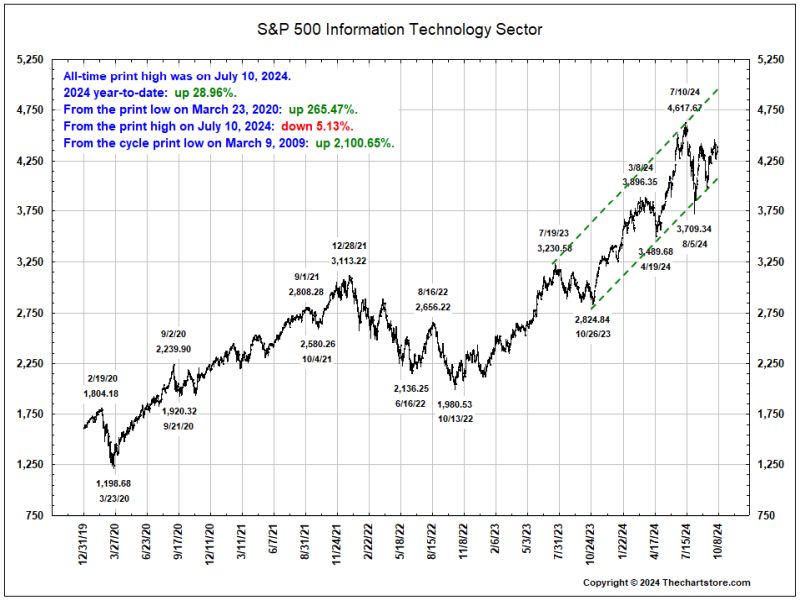
Chart 20

Chart 21
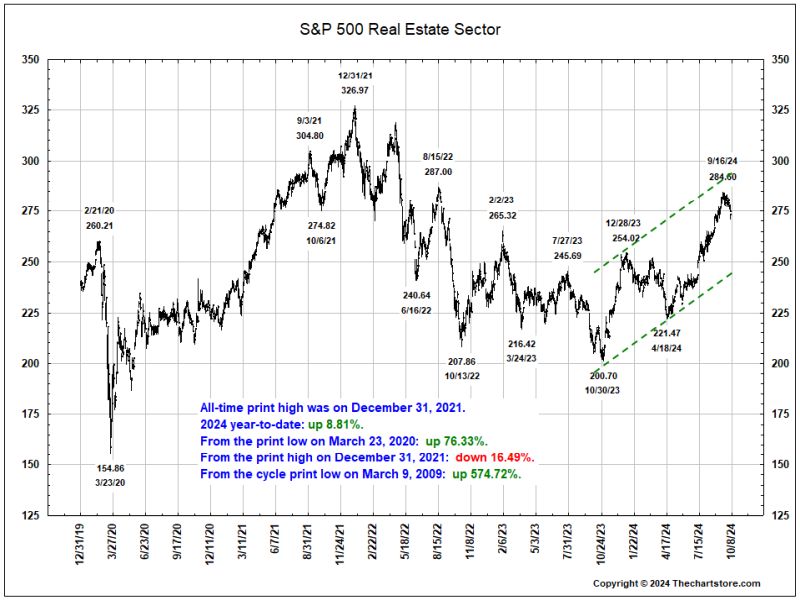
Chart 22
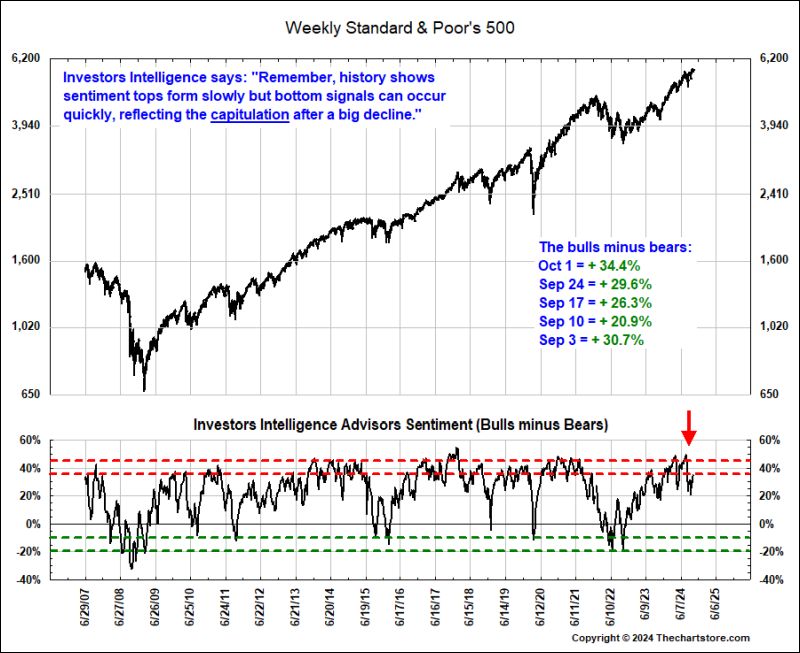
Stock Market Indicator Watch
Chart 23
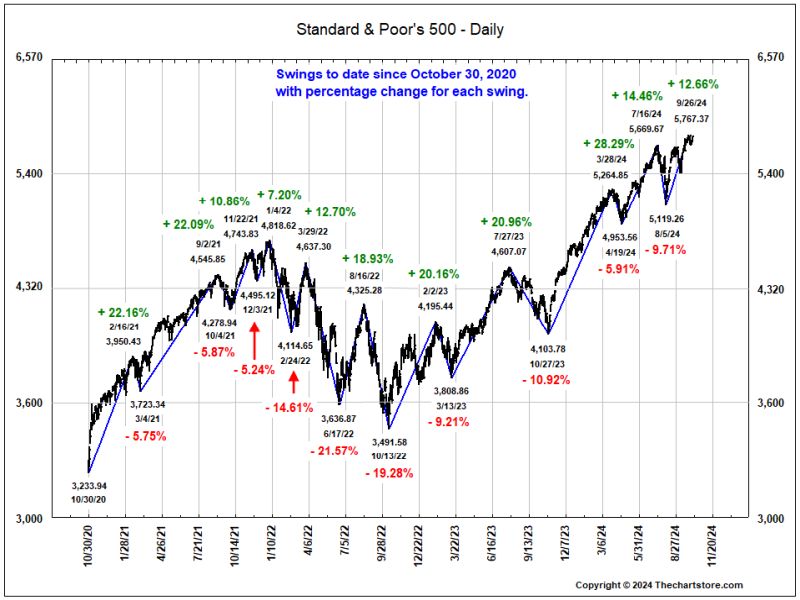
Chart 24
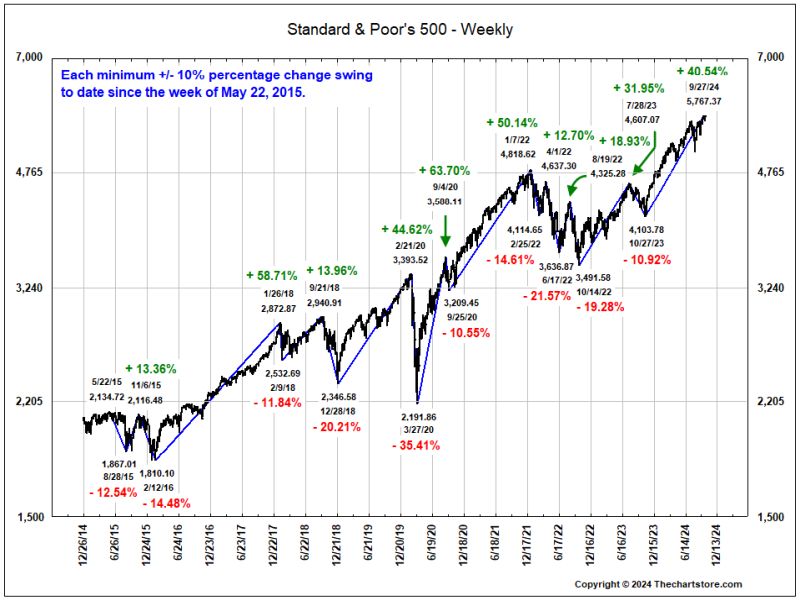
Chart 25
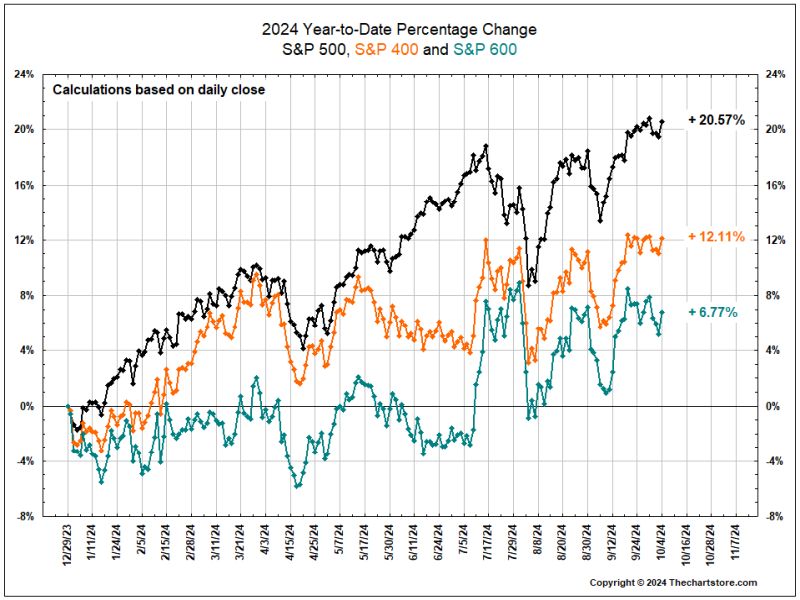
Chart 26
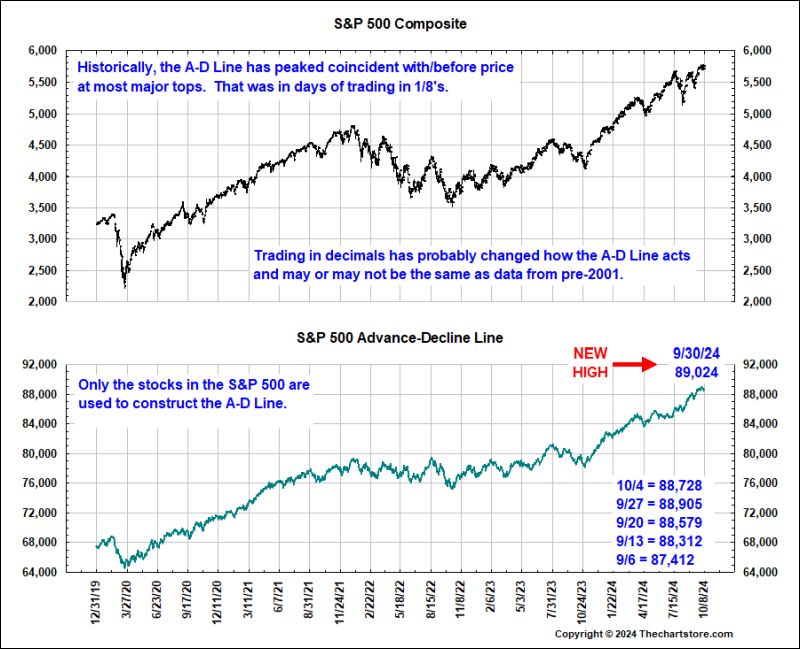
Chart 27
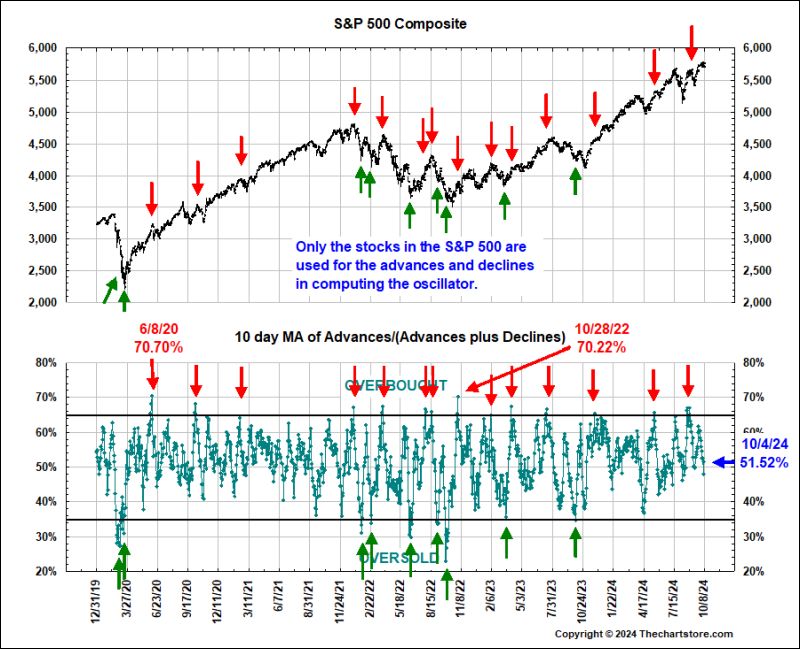
Chart 28
Chart 29
Chart 30
Chart 31
Chart 32
Chart 33

Chart 34
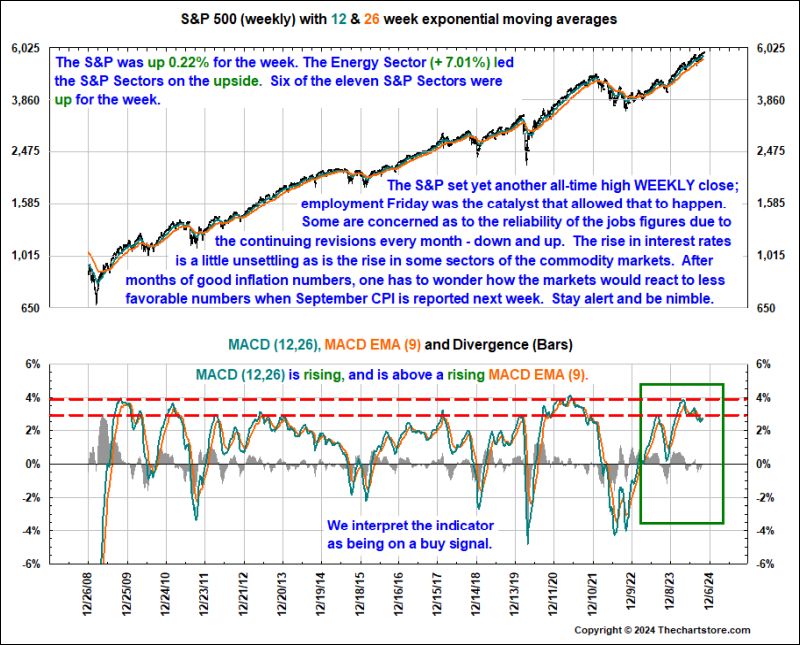
Chart 35
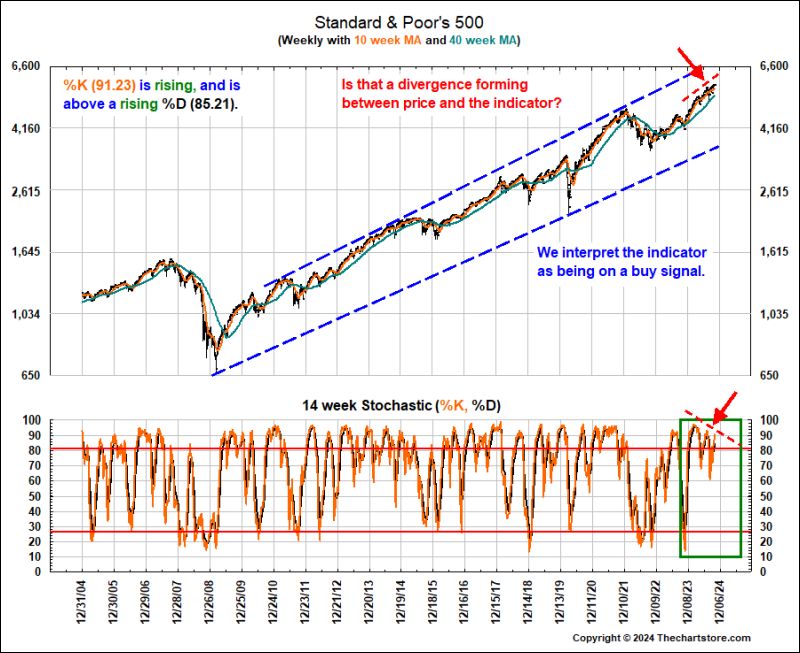
Chart 36
Analog Chart Watch
Chart 37
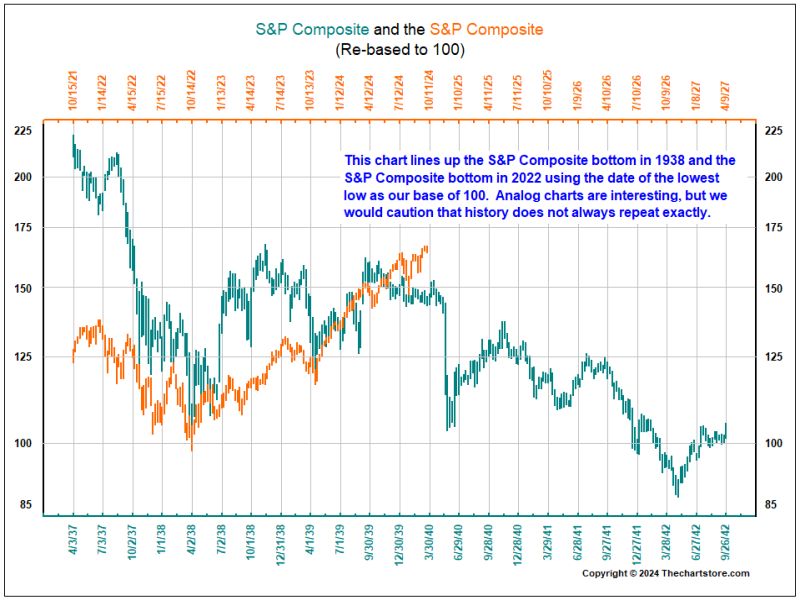
Chart 38
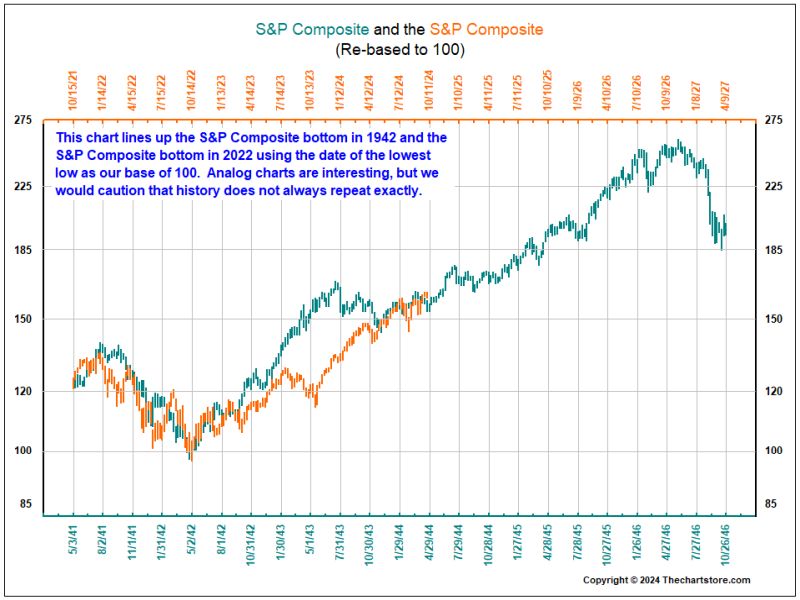
Chart 39
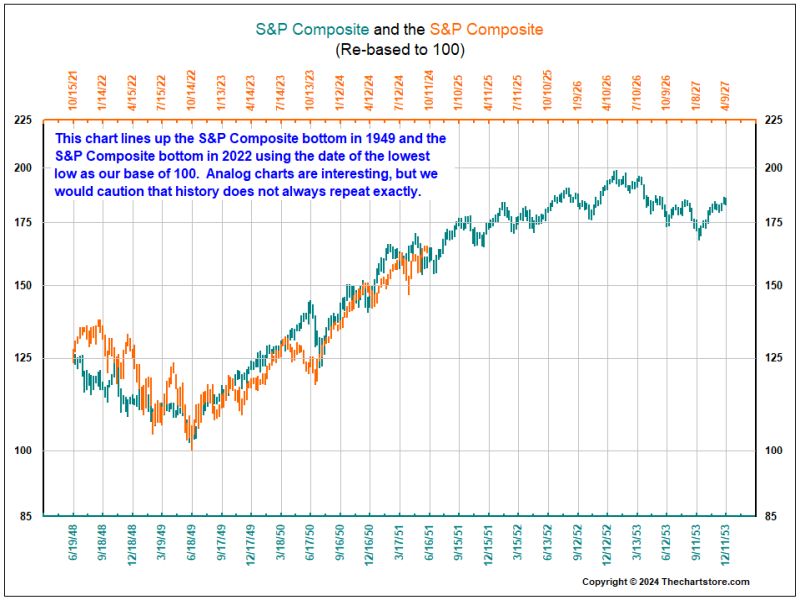
Chart 40
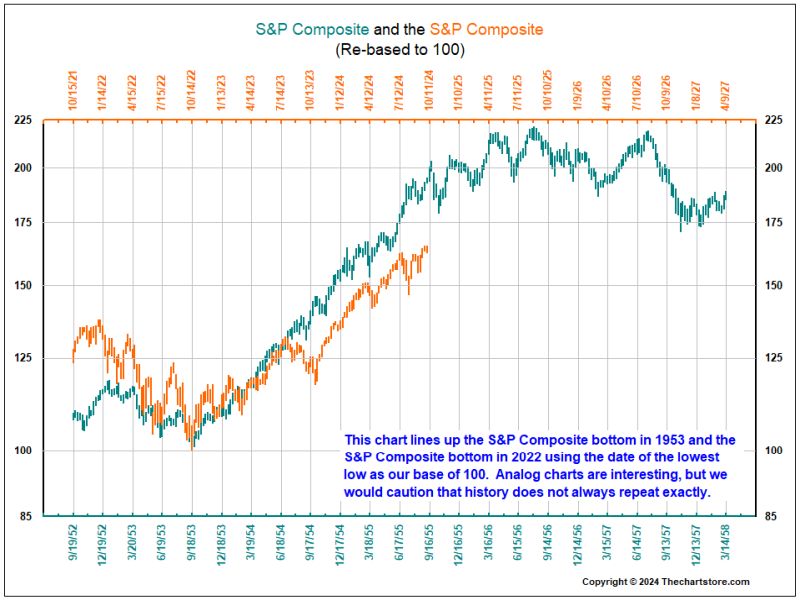
Chart 41
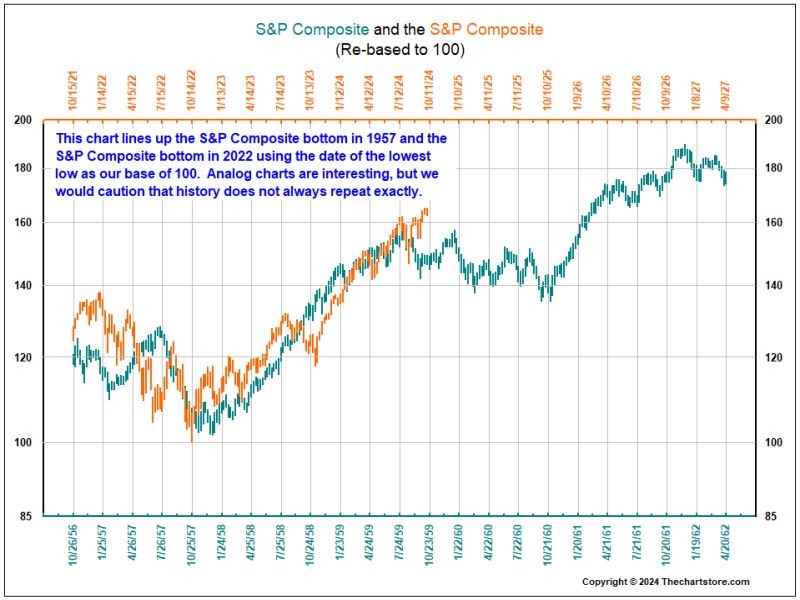
Chart 42
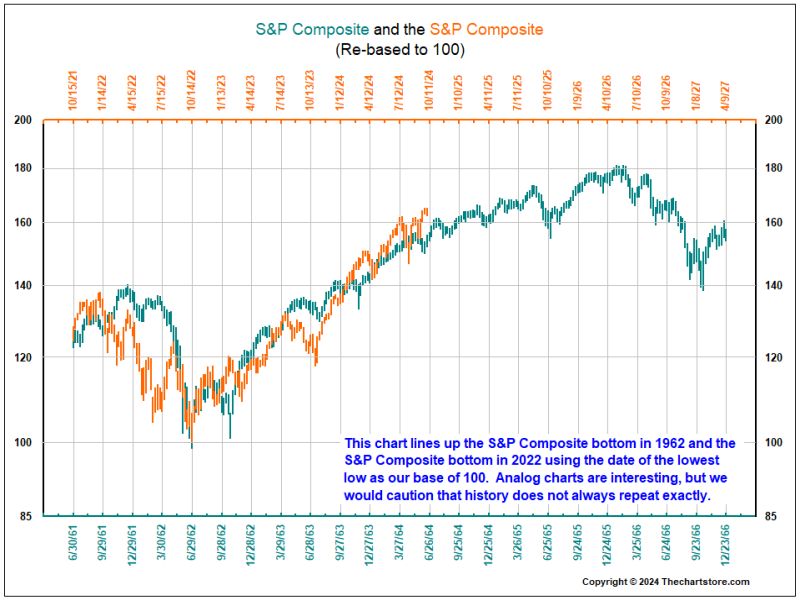
Chart 43
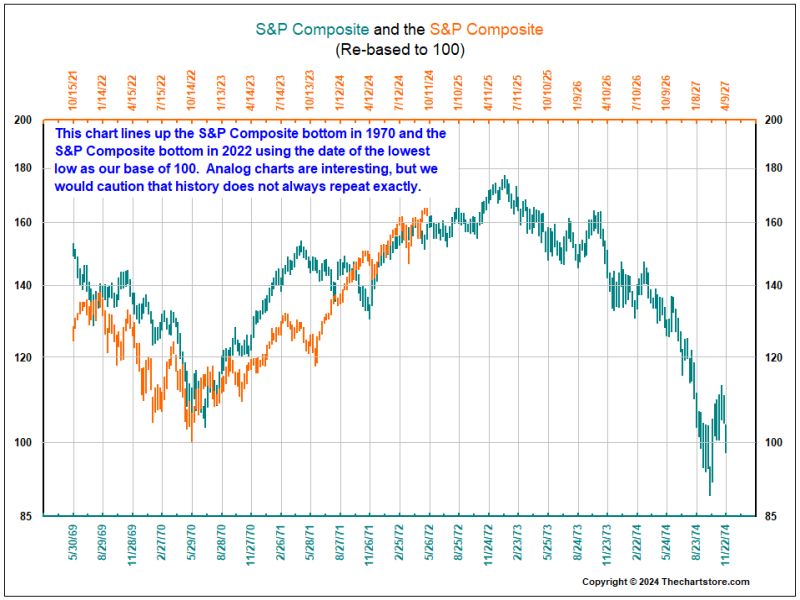
Chart 44
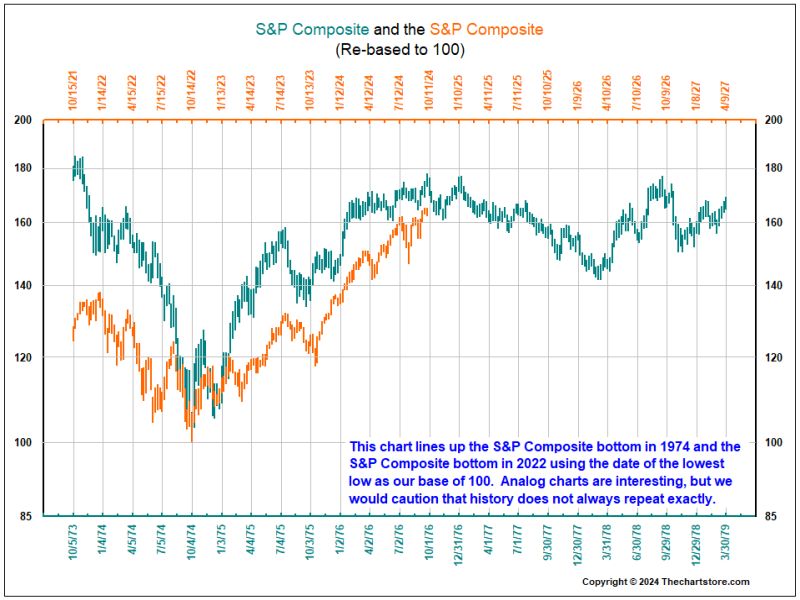
Chart 45
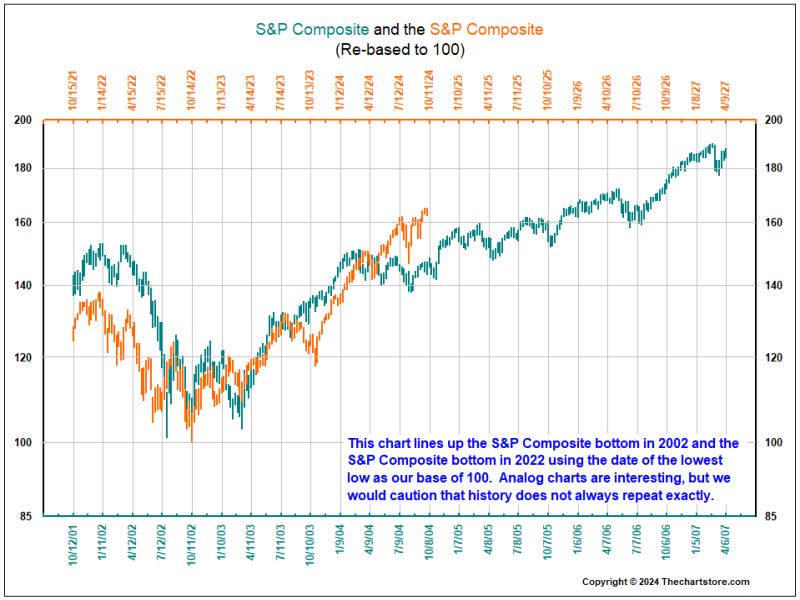
Chart 46
Interest Rate Watch
Chart 47
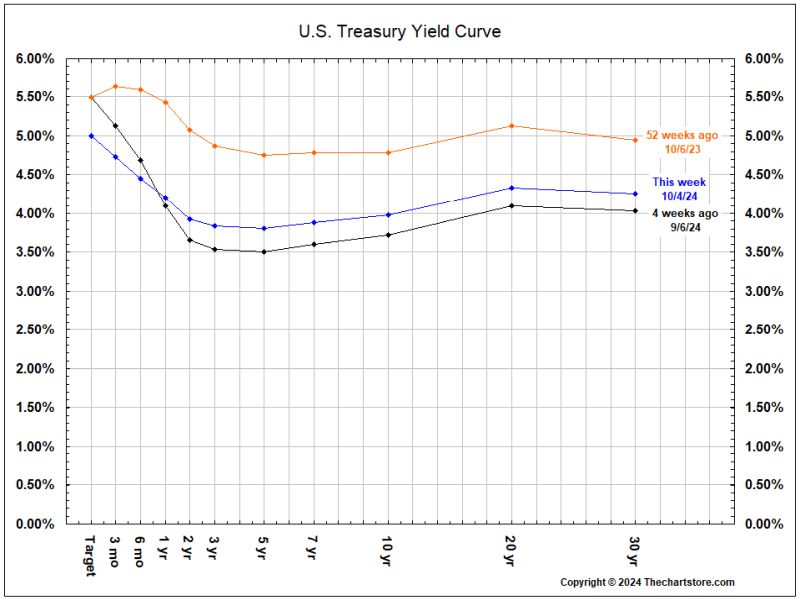
Chart 48
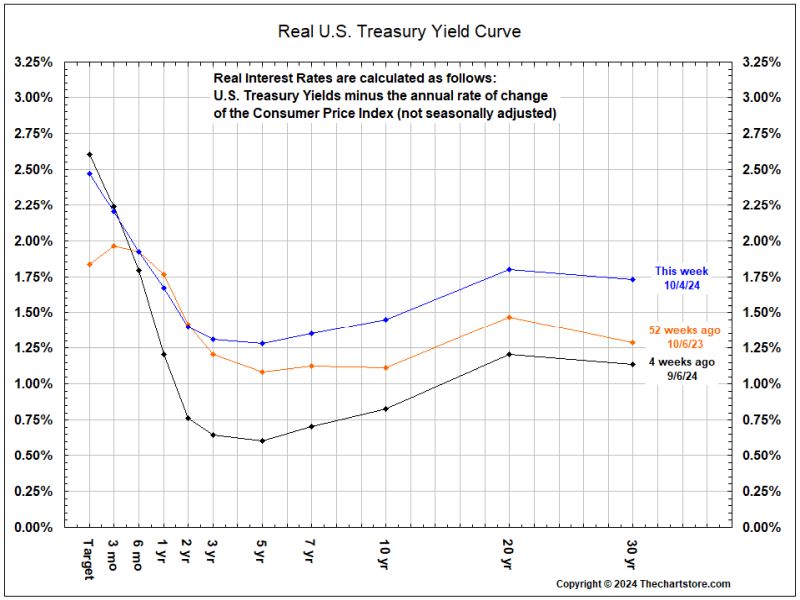
Chart 49

Chart 50
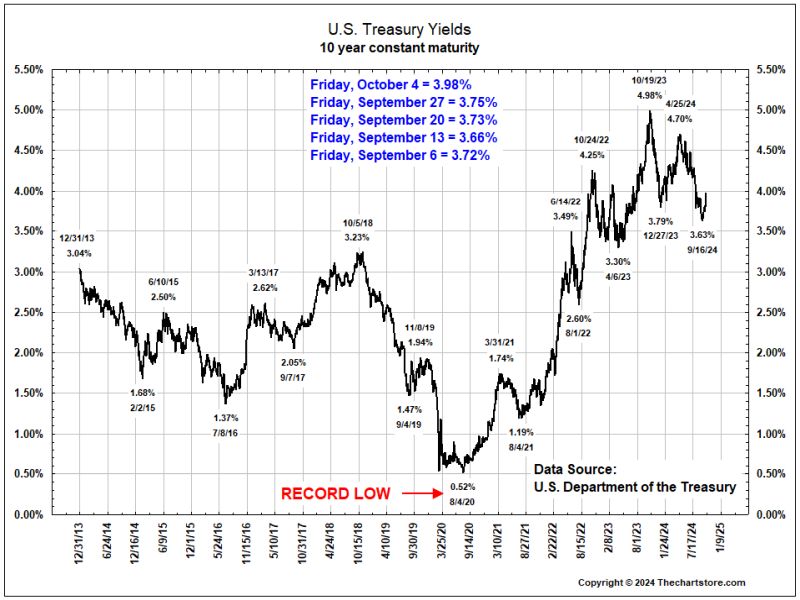
Chart 51
Chart 52
Chart 53
Chart 54
Chart 55
Chart 56
Chart 57
Chart 58
Chart 59
Chart 60
Chart 61
Chart 62
Chart 63
Chart 64
Chart 65
Chart 66
Currency Watch
Chart 67
Chart 68

Chart 69
Chart 70
Chart 71
Chart 72
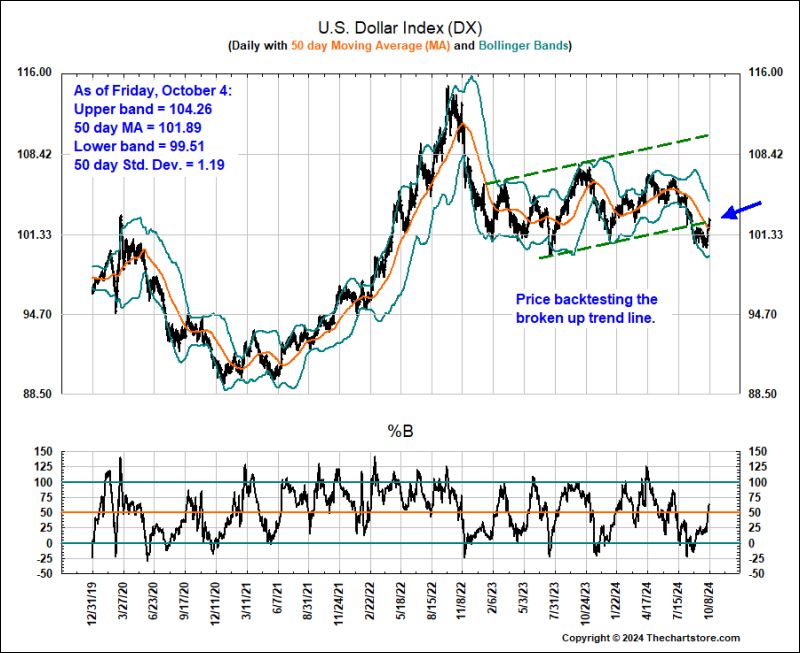
Chart 73
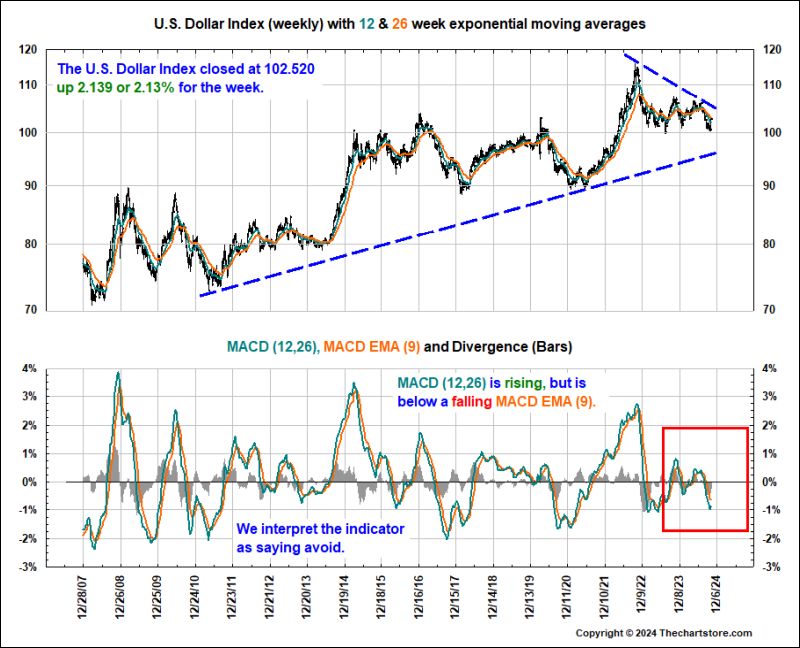
Chart 74
Commodity Watch
Chart 75

Chart 76
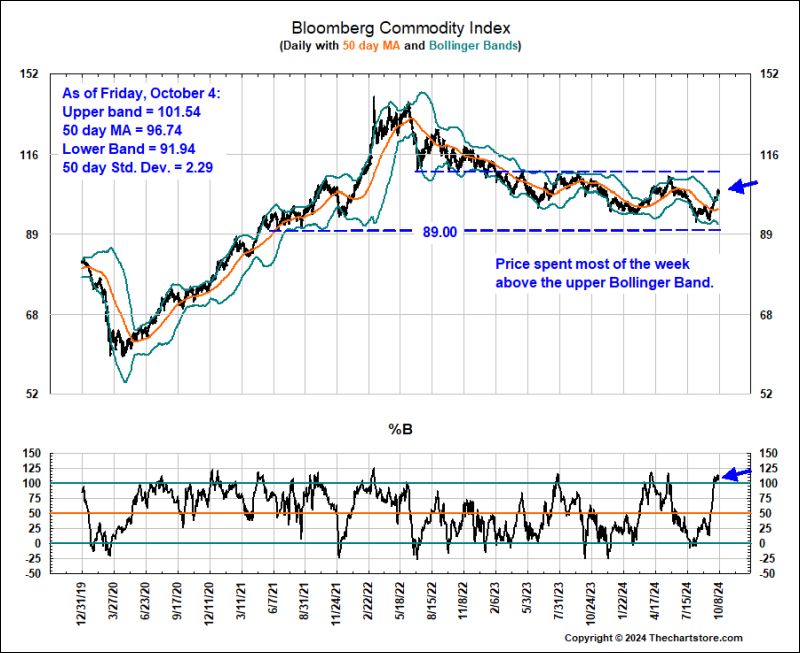
Chart 77
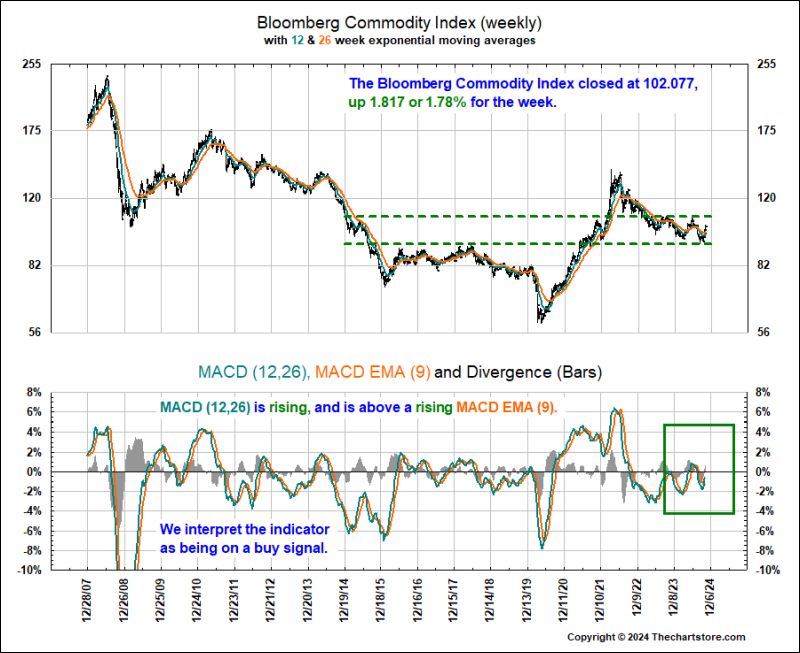
Chart 78
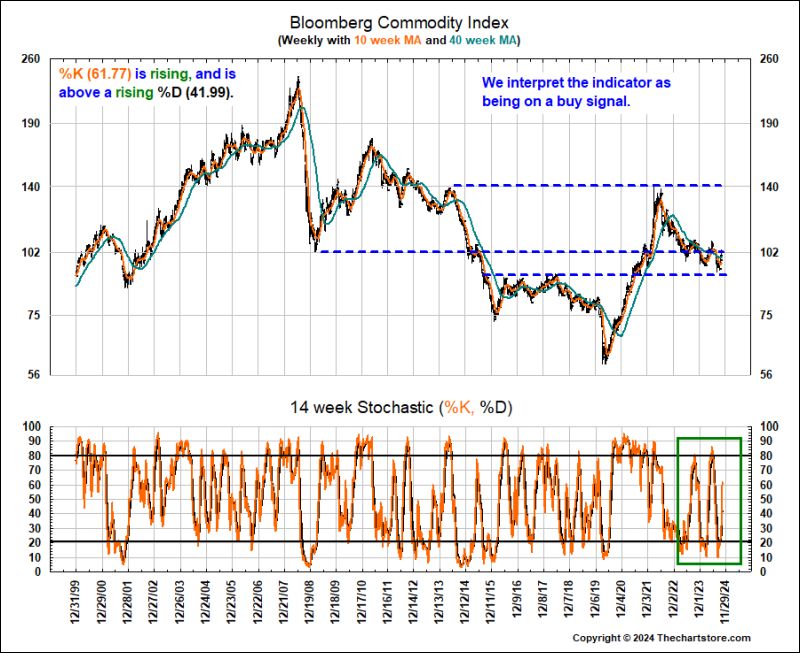
Chart 79
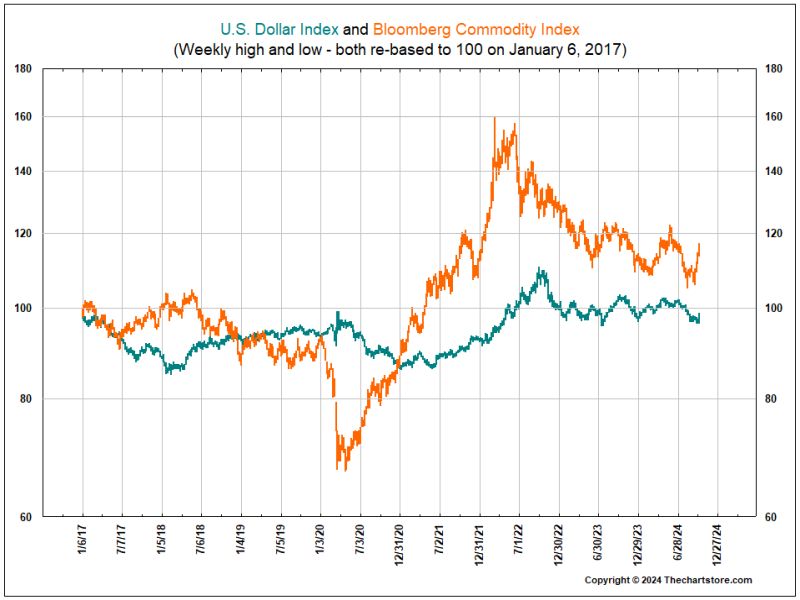
Chart 80
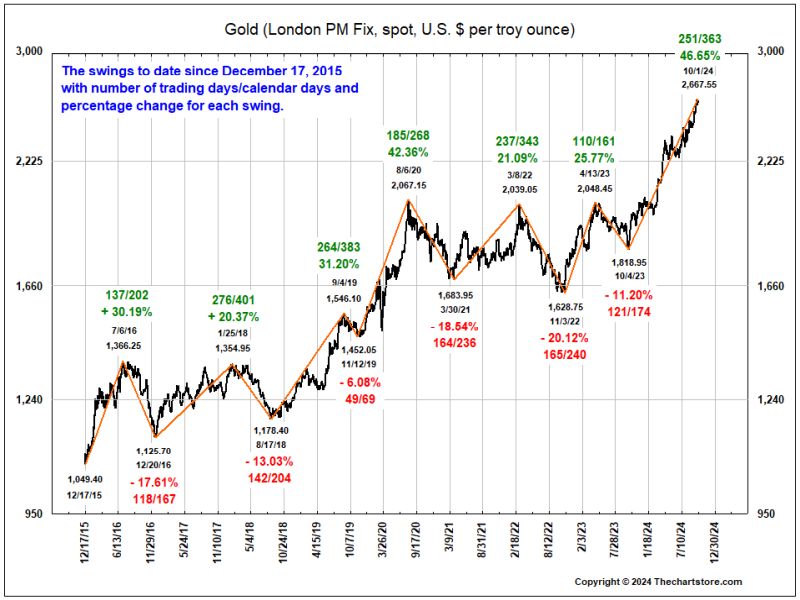
Chart 81
Chart 82
Chart 83
Chart 84
Chart 85
Chart 86
Chart 87

Chart 88
Chart 89
Chart 90
Chart 91
Chart 92
Chart 93
Chart 94
Chart 95
Chart 96
Fed Watch
Chart 97
Chart 98
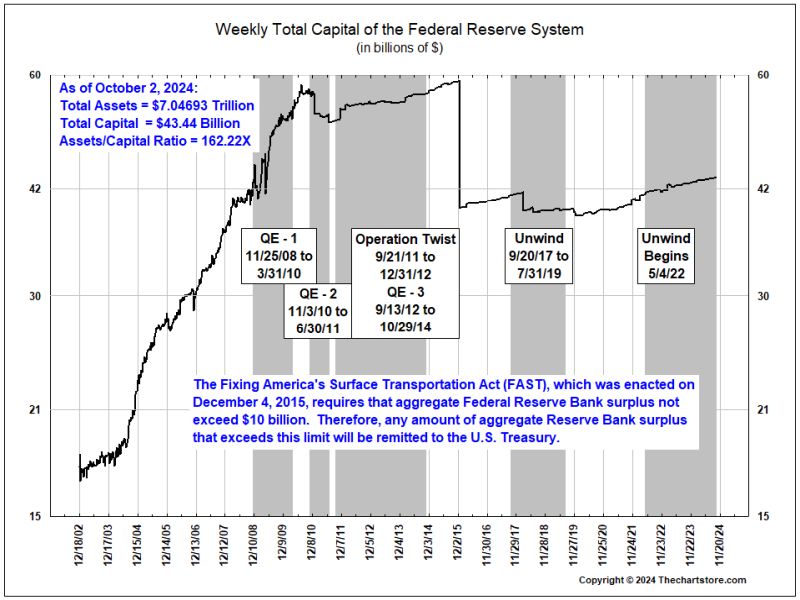
Chart 99
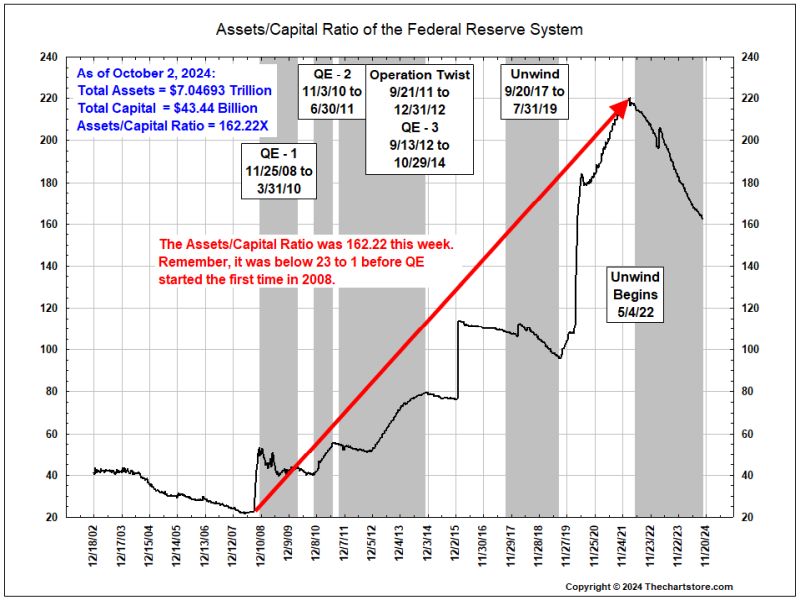
Chart 100
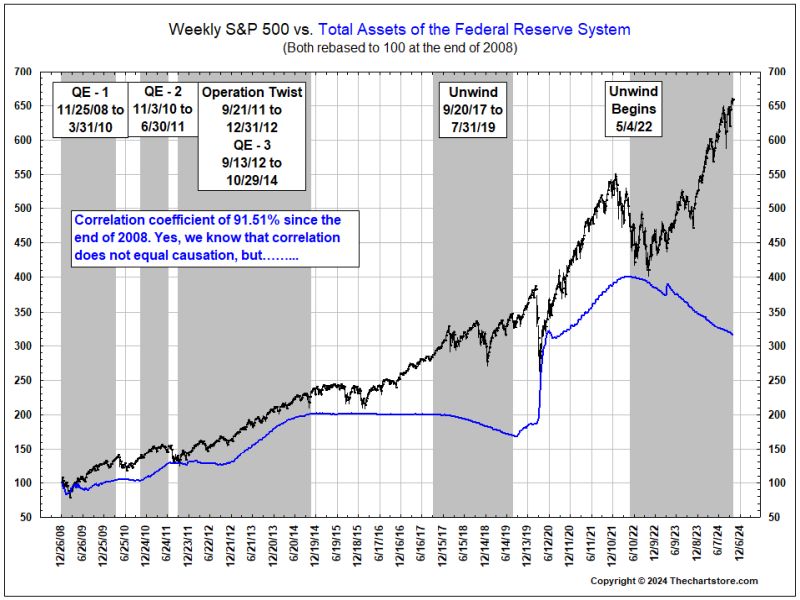
Chart 101
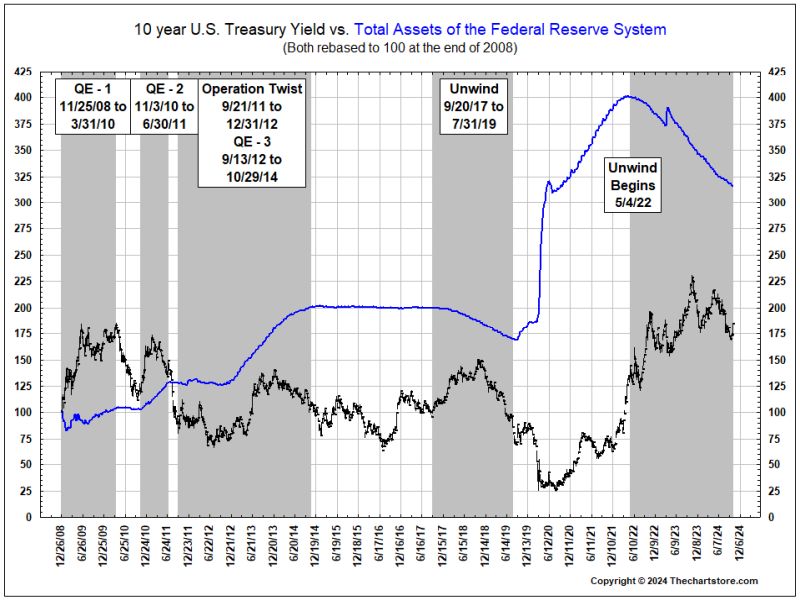
Chart 102
Chart 103
Chart 104

Chart 105
Chart 106
Monthly Stochastics Watch
Chart 107
Chart 108
Chart 109
Chart 110
Chart 111
Chart 112
Chart 113
Chart 114
ISM Manufacturing Purchasing Manager's Index Watch
SEPTEMBER 2024 MANUFACTURING INDEX SUMMARIES
Manufacturing PMI®
The U.S. manufacturing sector contracted for the sixth consecutive month in September, as the Manufacturing PMI® registered 47.2 percent, the same reading as in August. “After breaking a 16-month streak of contraction by expanding in March, the manufacturing sector has contracted the last six months. Of the five subindexes that directly factor into the Manufacturing PMI®, only one (Supplier Deliveries) was in expansion territory, the same as in August. The New Orders and Production indexes remained in contraction but moved upward in September. Of the six biggest manufacturing industries, only one (Food, Beverage & Tobacco Products) registered growth,” says Fiore. A reading above 50 percent indicates that the manufacturing sector is generally expanding; below 50 percent indicates that it is generally contracting.
A Manufacturing PMI® above 42.5 percent, over a period of time, generally indicates an expansion of the overall economy. Therefore, the September Manufacturing PMI® indicates the overall economy grew for the 53rd straight month after last contracting in April 2020. “The past relationship between the Manufacturing PMI® and the overall economy indicates that the September reading (47.2 percent) corresponds to a change of plus-1.3 percent in real gross domestic product (GDP) on an annualized basis,” says Fiore.
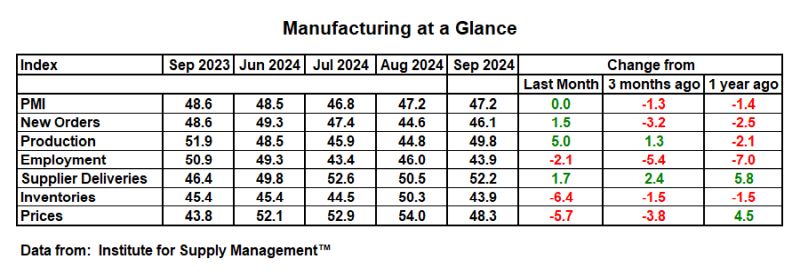
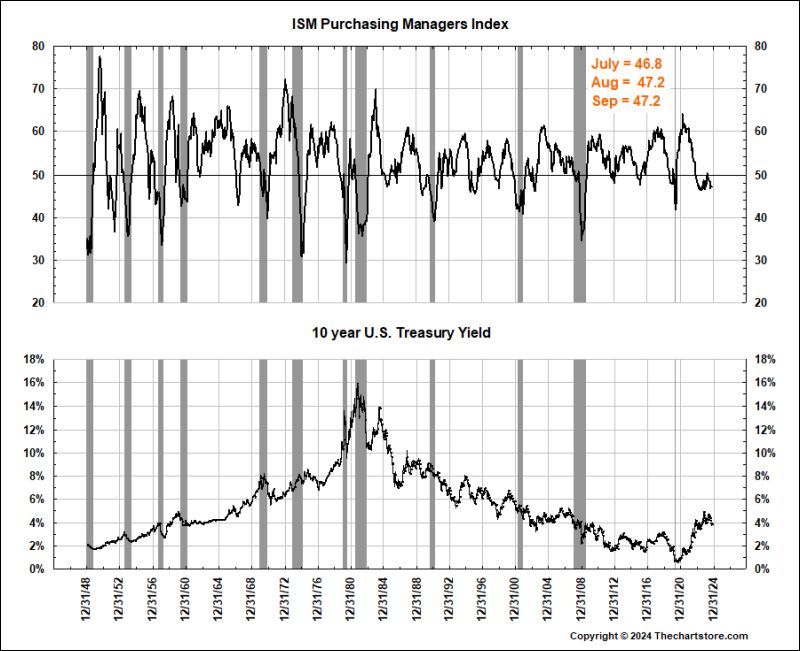
Chart 115
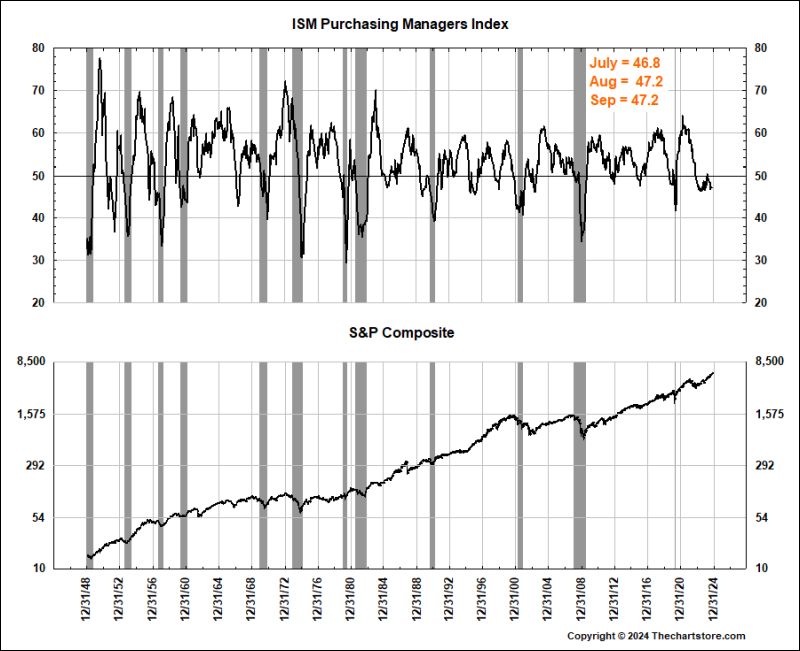
Chart 116
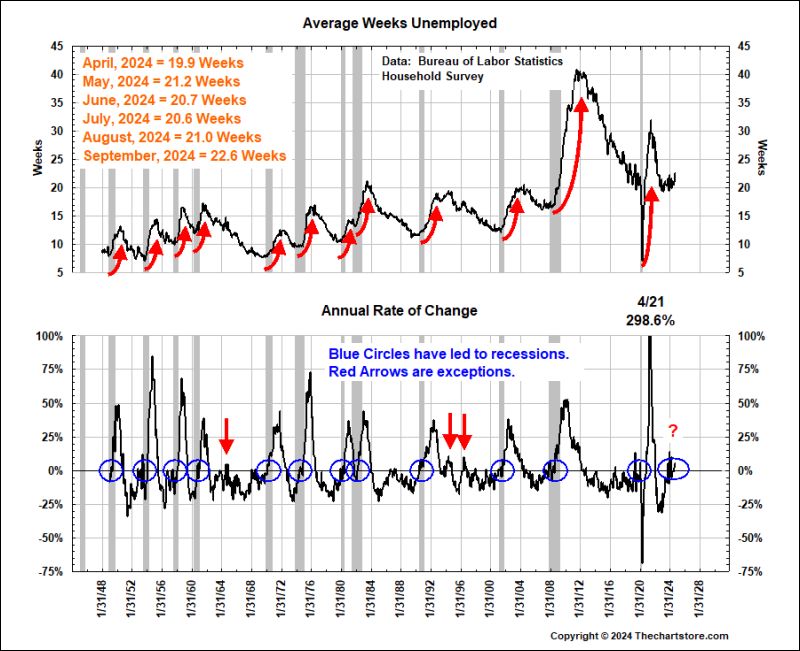
The Employment Situation Watch
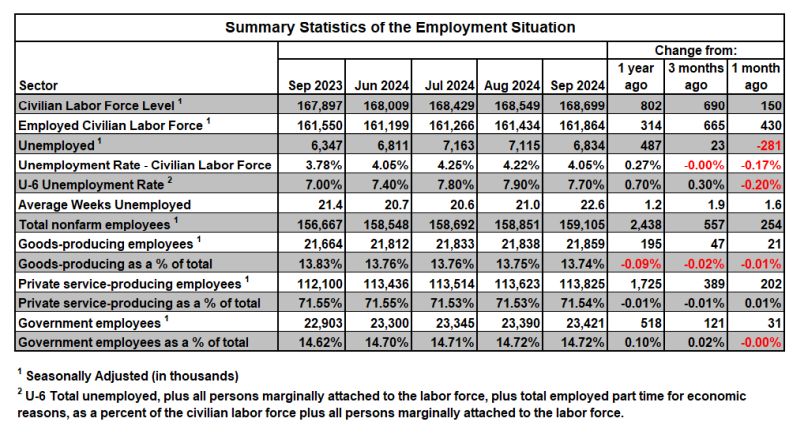
Chart 117
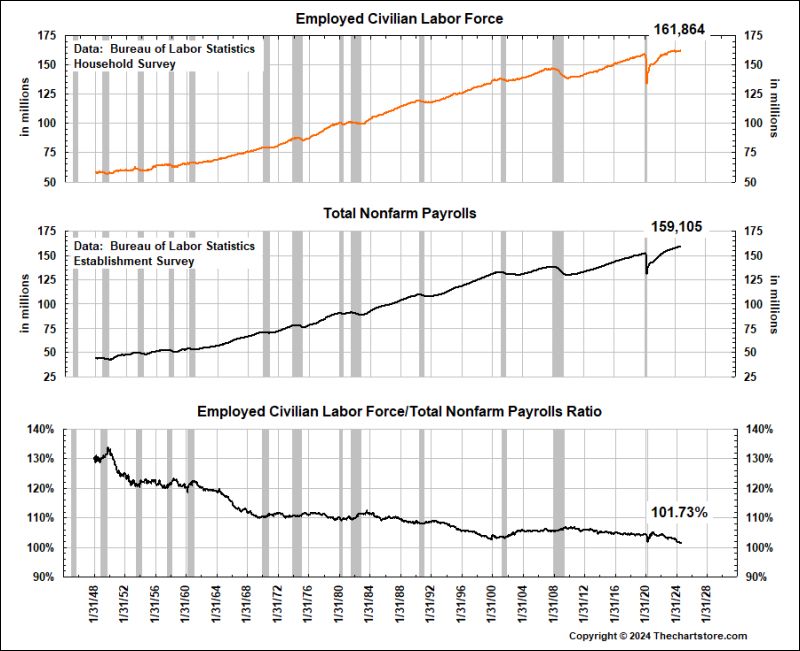
Chart 118
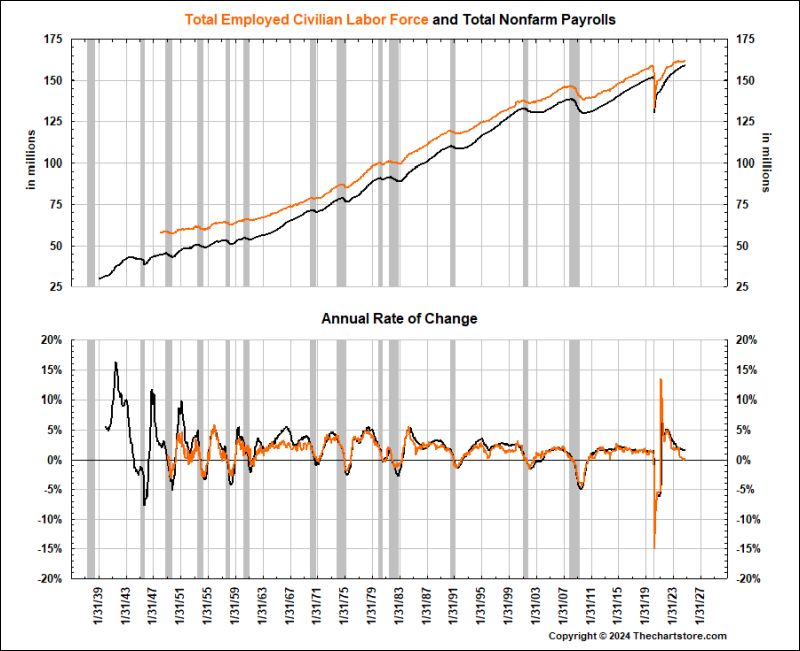
Chart 119
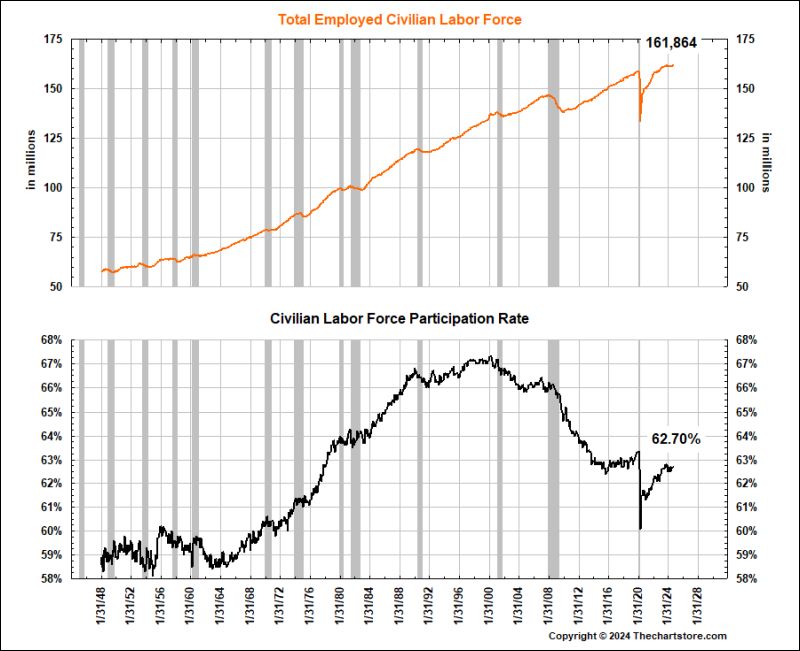
Chart 120
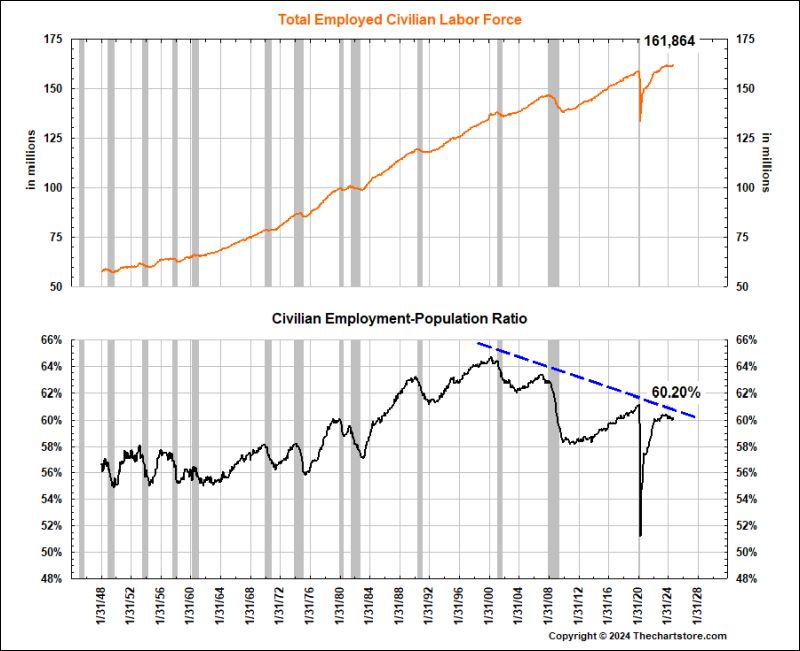
Chart 121
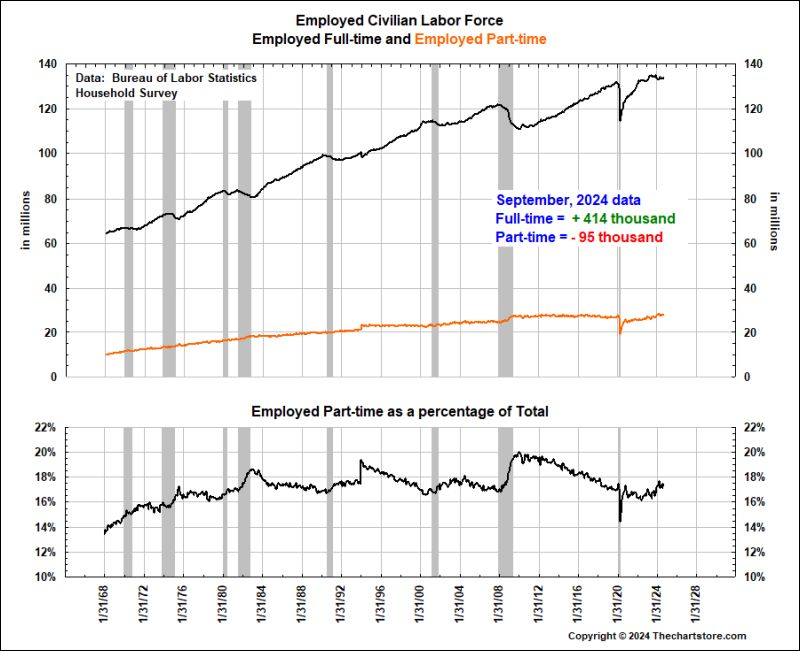
Chart 122
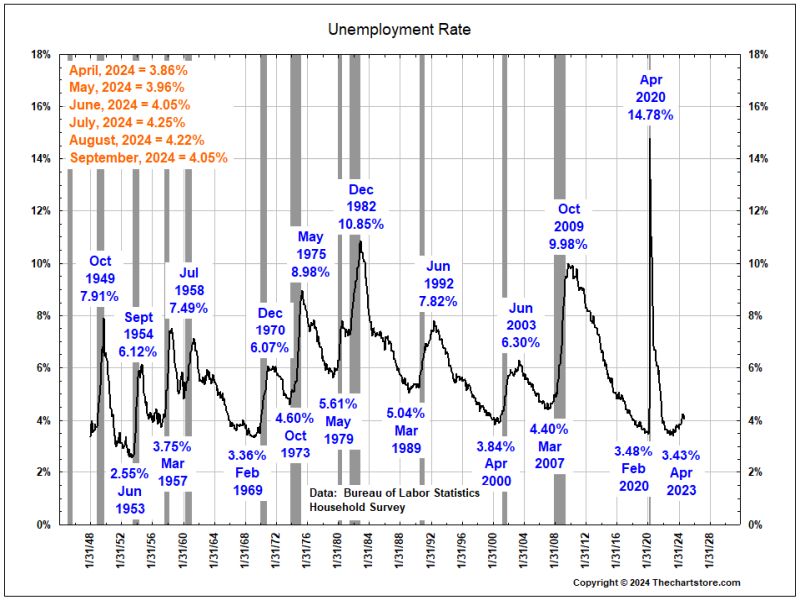
Chart 123
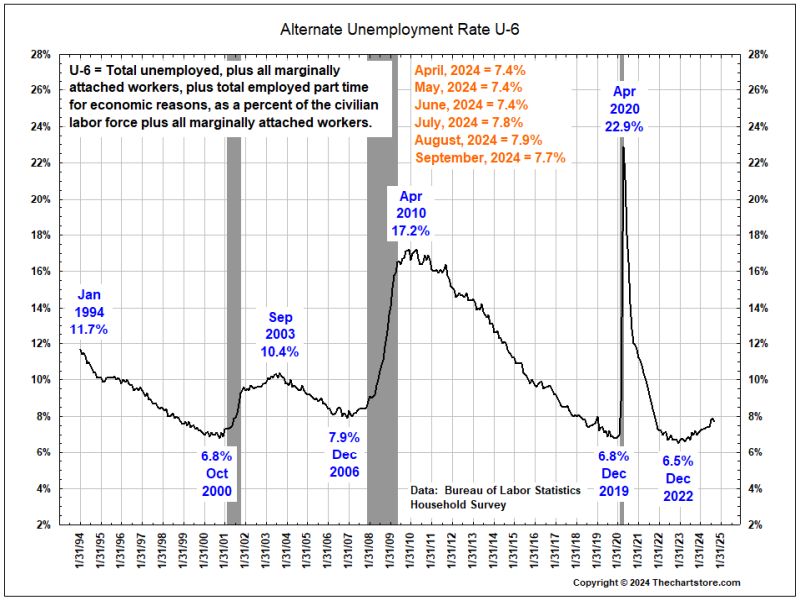
Chart 124
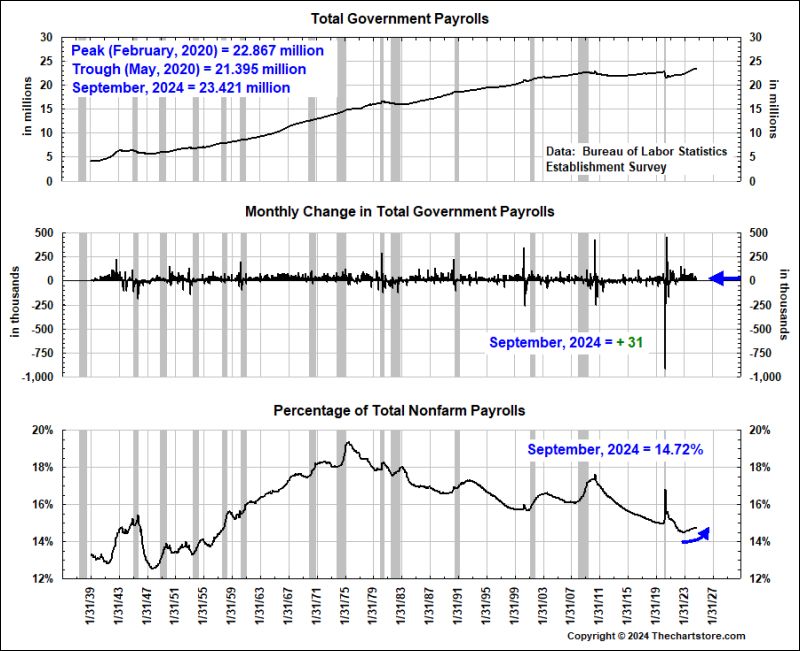
Nonfarm Payroll Watch
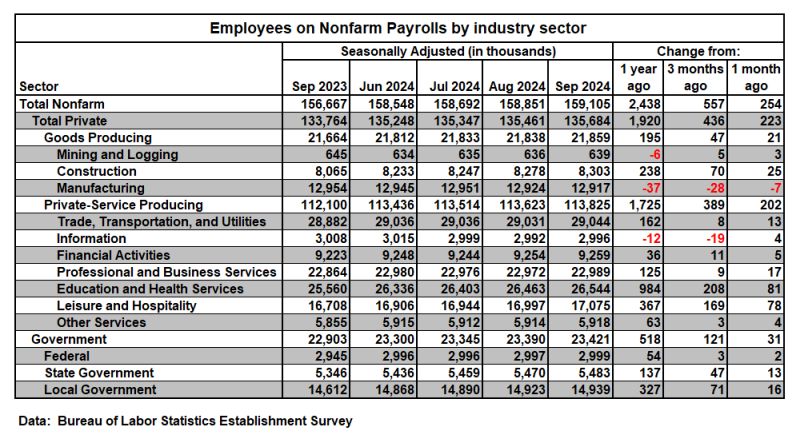
Chart 125
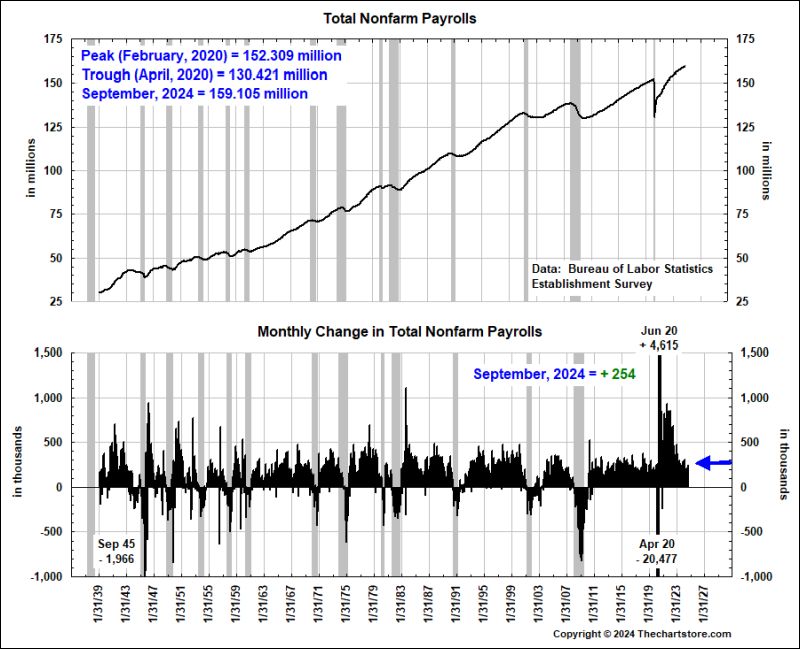
Chart 126
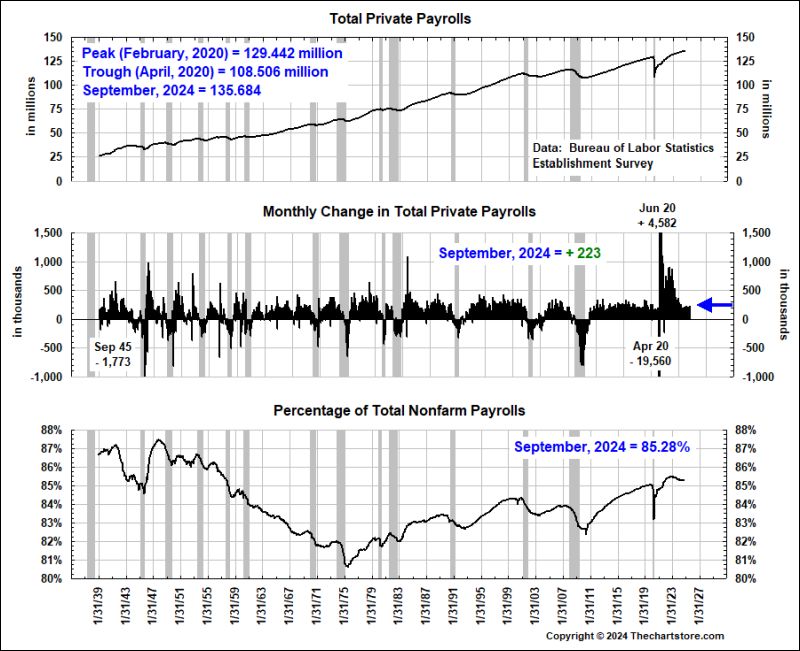
Chart 127
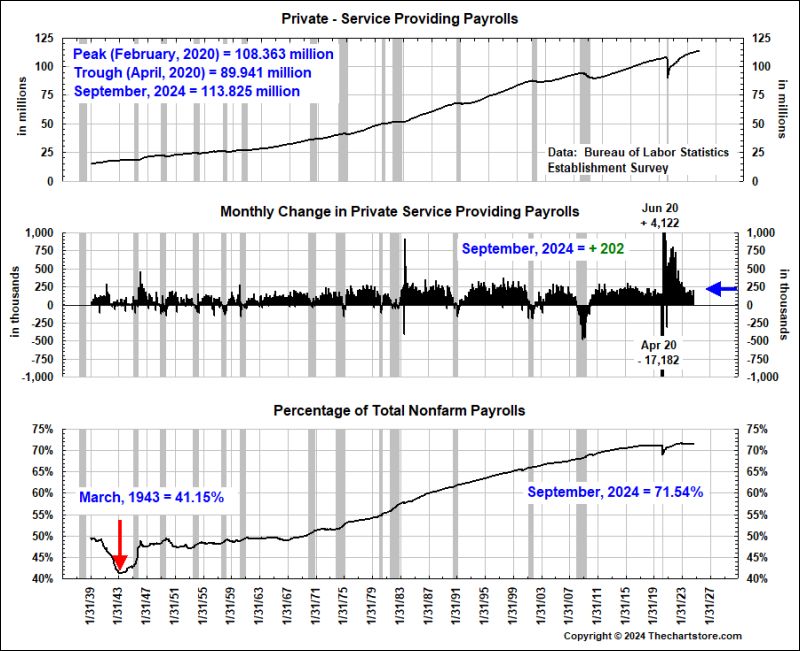
Chart 128
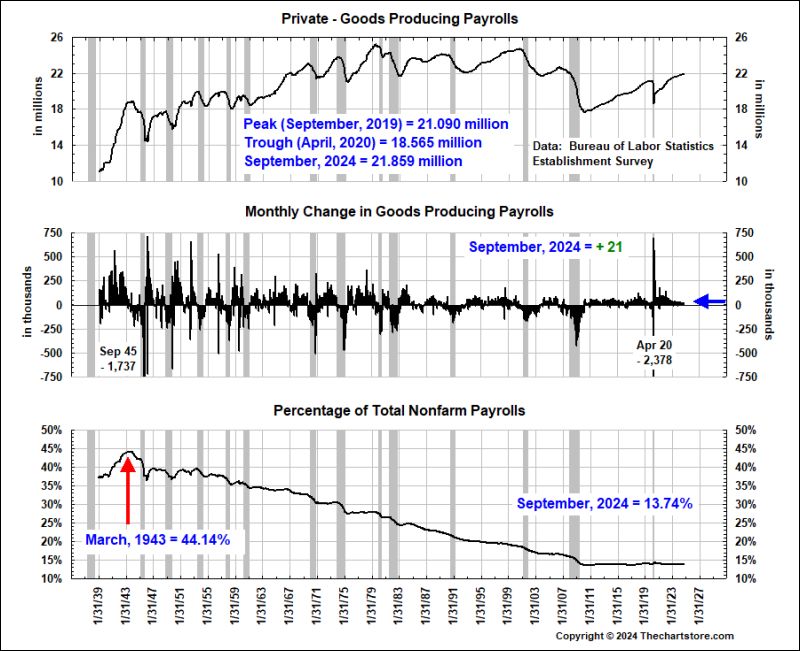
Chart 129
Employee Compensation Watch
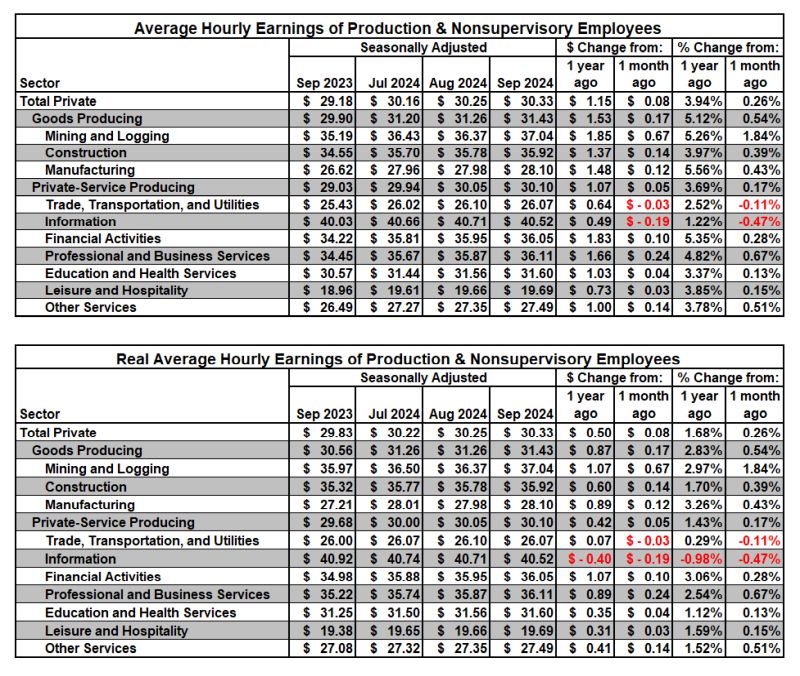
Chart 130
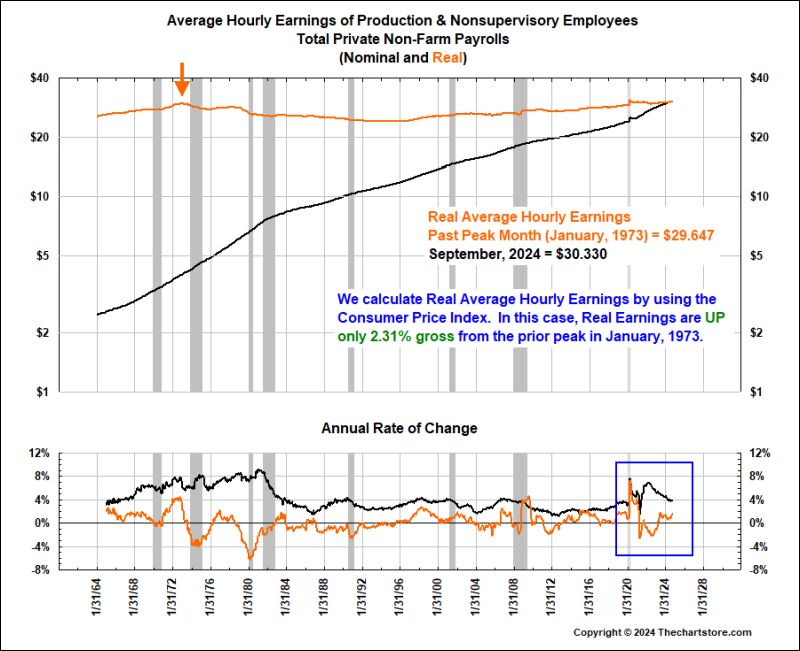
Chart 131

Chart 132
Hours of Work to Buy Watch
Chart 133
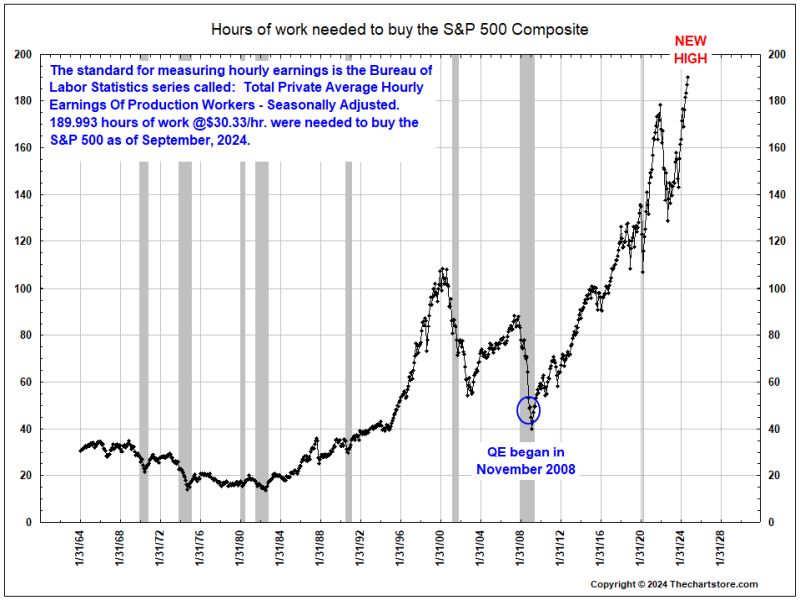
Chart 134
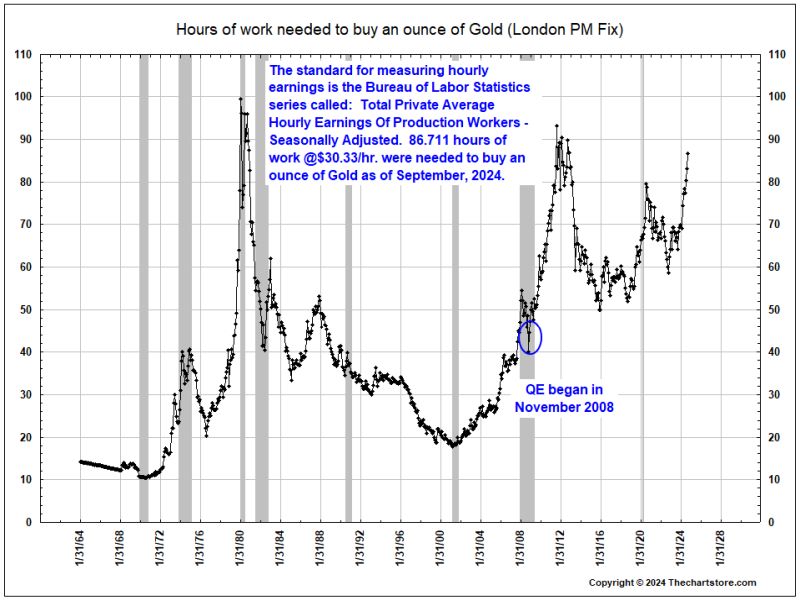
Chart 135
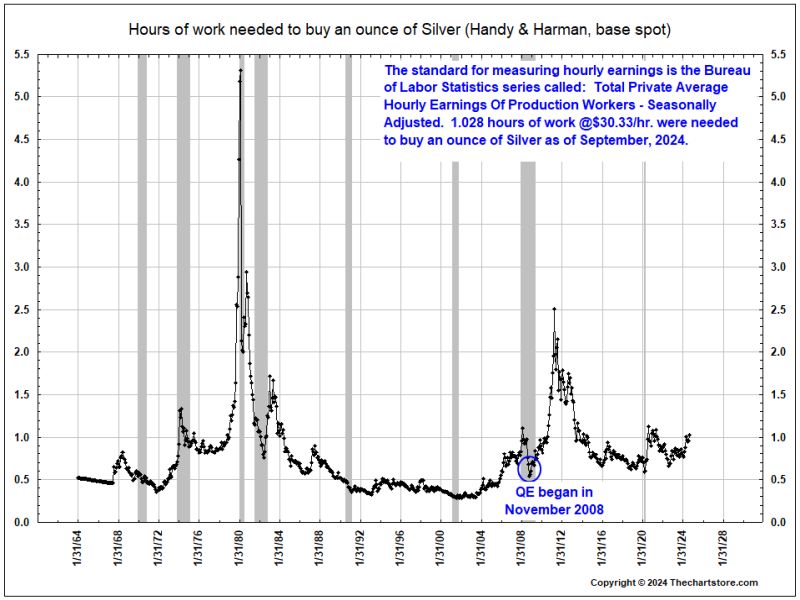
Chart 136
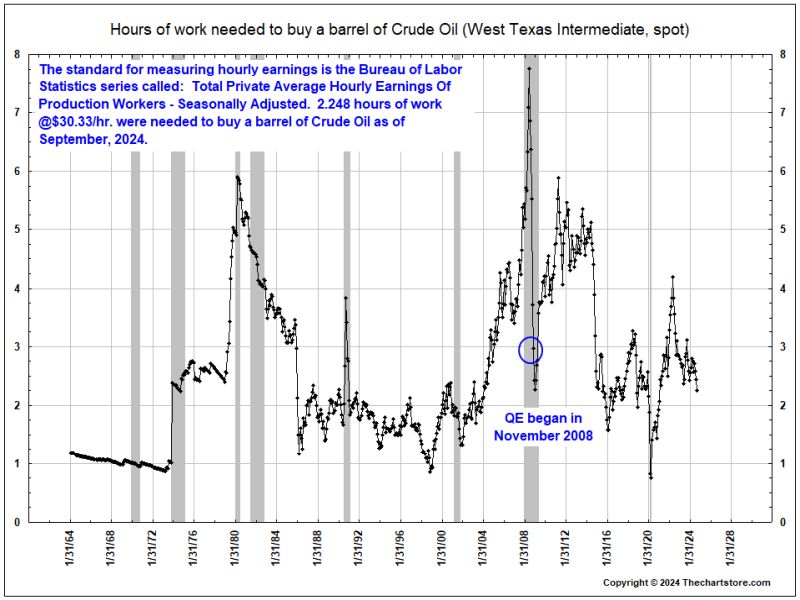
Chart 137

Chart 138
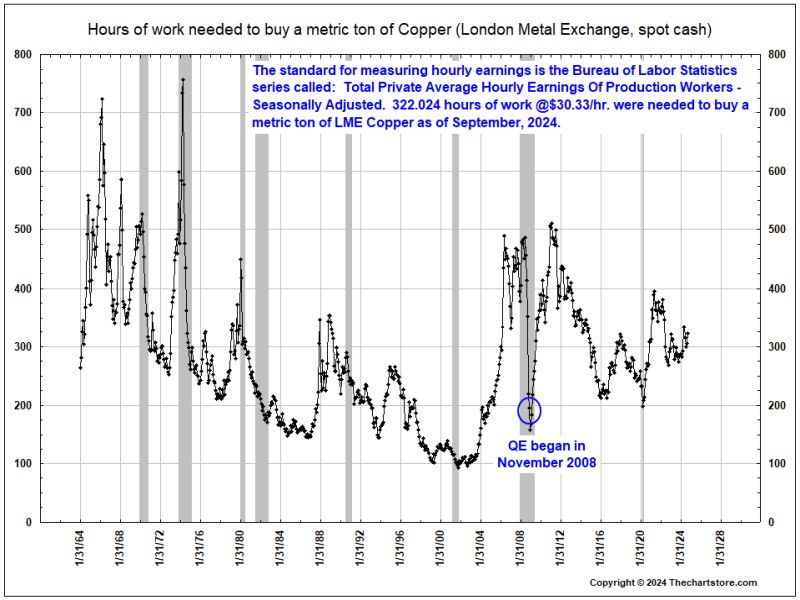
Chart 139
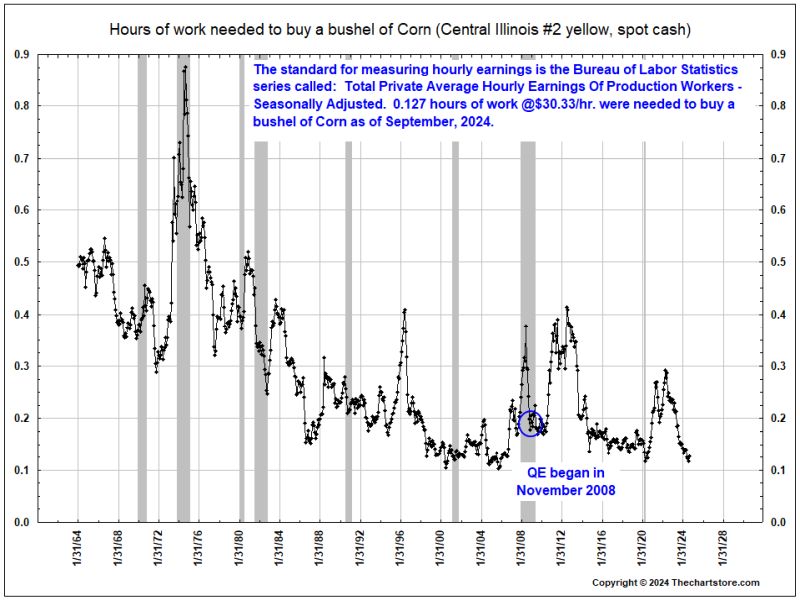
Chart 140
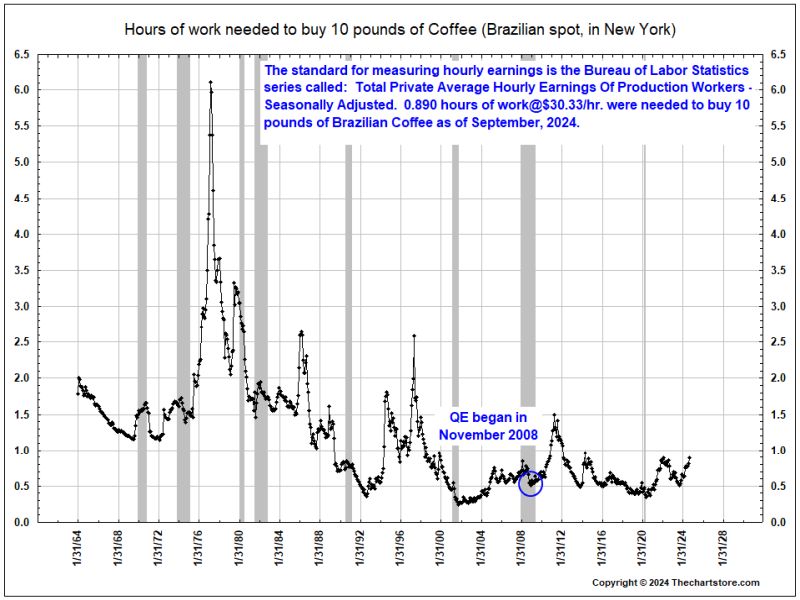
Chart 141
That's it for this week...
To send us an email with a comment on this blog, click here.
Thechartstore.com does not promote the use of the information contained herein for any specific purpose, and makes no representations or warranties that the information contained in this publication is suitable for the particular purposes of the subscriber or any other party. Thechartstore.com assumes no responsibility or liability of any kind for the use of the information contained herein by the subscriber or any other party. Reproduction of any or all of the Weekly Chart Blog without prior permission is prohibited.